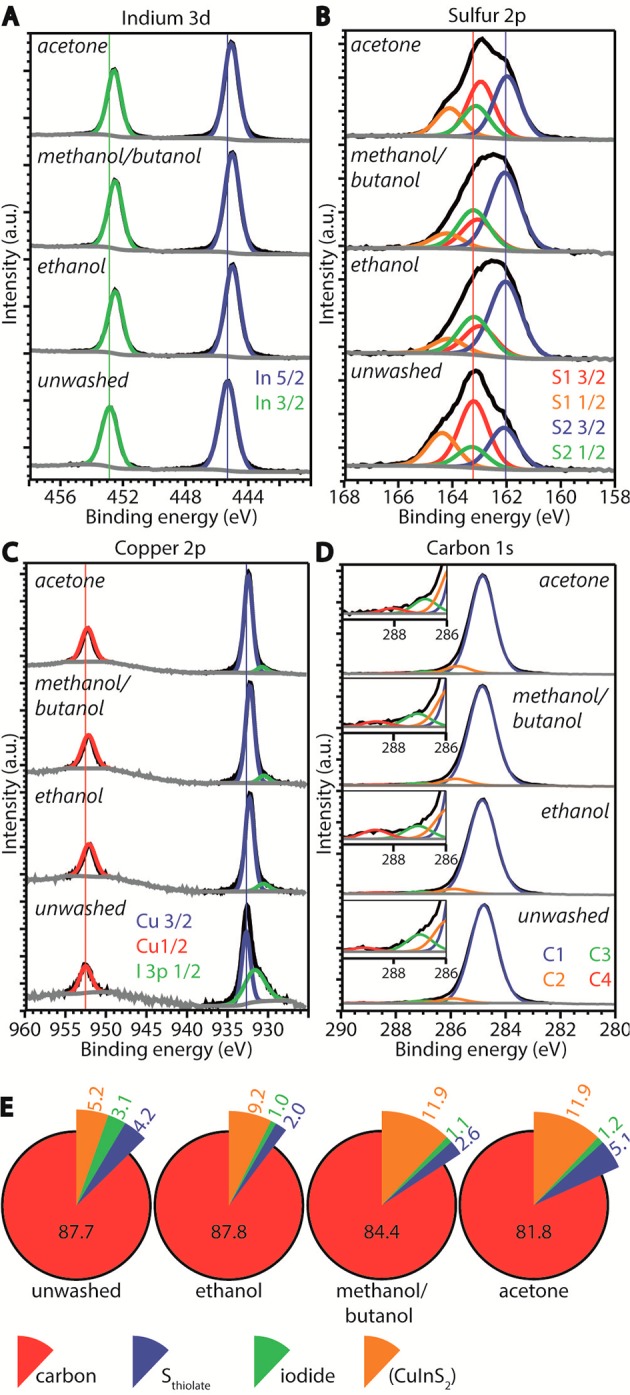
Figure 4.

XPS spectra of (A) indium, (B) sulfur, (C) copper, and (D) carbon. The measured signal is shown in black, the fits to the peaks in colors, and to the background in gray. The numbers in the legends in panels B and D denote the number of different sulfur and carbon species, respectively. In the inset in panel D, the carboxylic C 1s peak at 288.6 eV (red line) is clearly visible in the ethanol washed sample. (E) Relative concentrations of the relevant elements. The concentrations of Cu, In, and S are shown together as “CuInS2”.
