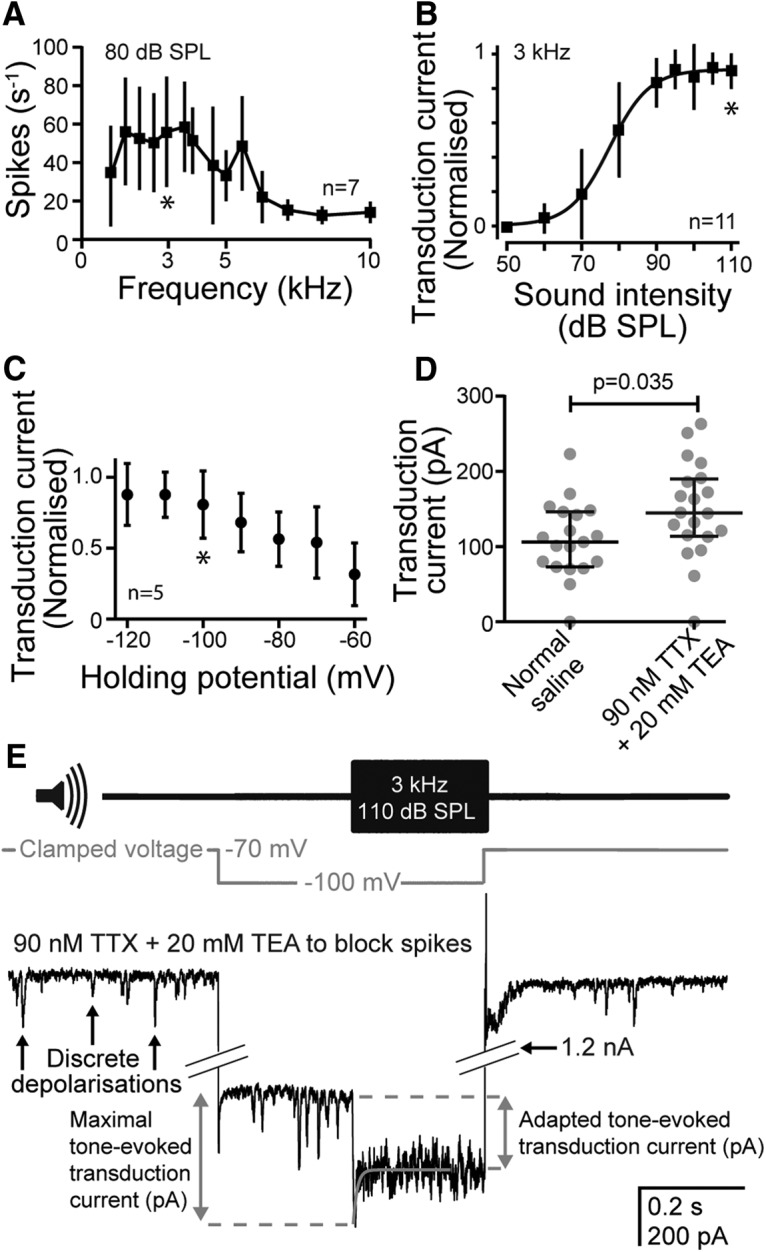
Figure 6.

Characterization of Group III auditory neuron response to sound. A, Frequency tuning of Group III auditory neurons to 80 dB SPL pure tones (n = 7, N = 4). The asterisk indicates the frequency (3 kHz) that was used in all subsequent characterizations of the transduction current. B, Dependence of the transduction current on the sound intensity of a 3 kHz pure tone (n = 11, N = 11). The asterisk indicates the SPL (110 dB) that was used in all subsequent characterizations of the transduction current. C, Dependence of the transduction current on the holding potential. The asterisk indicates the holding potential used in all subsequent characterization of the transduction current. D, Dependence of the transduction current on the presence of 90 nm extracellular TTX and 20 mm intracellular TEA. E, Voltage-clamp protocol used to maximize the transduction current using extracellular application of 90 nm TTX and intracellular application of 20 mm TEA to block sodium and potassium conductance; voltage clamp to −100 mV (gray trace); and a 3 kHz tone at 110 dB SPL (top trace). The transduction current was maximal at tone onset before rapidly adapting to an adapted transduction current (gray dashed lines). Adaptation of the transduction current was fitted with a first-order exponential equation (gray line overlying the transduction current. For A–C, standard deviation was plotted and for D, median and interquartile ranges are overlaid on the data points.
