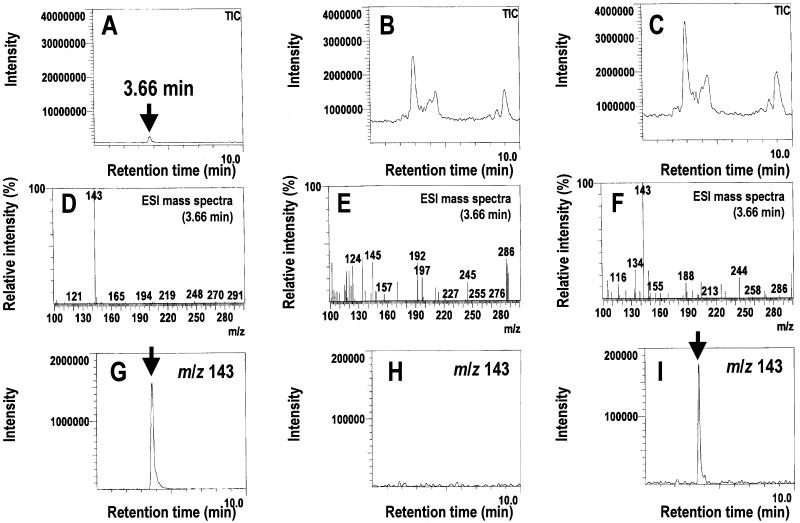
Figure 3.
Detection of ectoine accumulated in transgenic BY2 cells using LC/ESIMS. A, TIC of standard ectoine. B, TIC of untransformed BY2 (WT) cells. C, TIC of the ECT-80 clone. D, ESI mass spectra at 3.66 min of standard ectoine. E, ESI mass spectra at 3.66 min of the WT cells. F, ESI mass spectra at 3.66 min of the ECT-80 clone. G, Computer-reconstructed mass chromatogram of m/z 143 of standard ectoine. H, Computer-reconstructed mass chromatogram of m/z 143 of the WT cells. I, Computer-reconstructed mass chromatogram of m/z 143 of the ECT-80 clone. The arrows indicate the ectoine peak.

