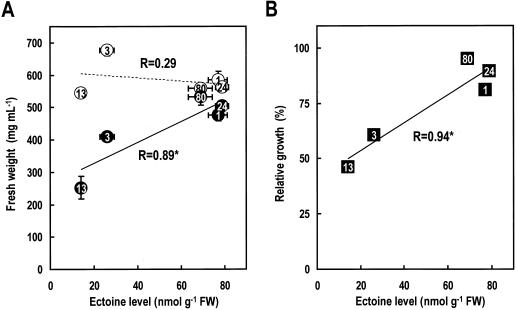
Figure 5.
Relationship between ectoine level and cell growth in transgenic BY2 cells. A, Fresh weight of BY2 cells was measured at 5 d after iso-osmotic treatment with 180 mm mannitol solution (control, ○), and hyperosmotic shock treatment with 620 mm mannitol solution (●). Data for ectoine level are from Figure 4. Error bars represent ±sd (n = 3). B, Relative growth of each clone was determined as the ratio of the fresh weight of cells that had been treated with hyperosmotic shock to the fresh weight of control cells. Asterisks indicate P < 0.05. The numbers in circles and squares correspond to the ECT clone numbers.

