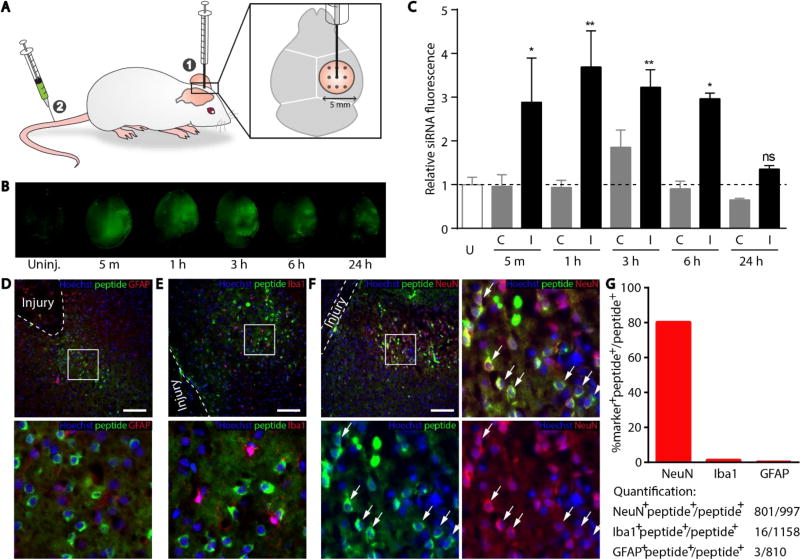
Figure 5. Accumulation of RVG-targeted nanoparticles in the injured brain.
(A) Schematic of the simulated TBI in mice. (B) Accumulation of fluorescently labeled particles in the injured hemisphere (right) when administered intravenously 5 min, 1 h, 3 h, 6, h and 24 h after injury. Uninjured brain administered particles serves as a control. (C) Quantification of nanoparticle accumulation in the contralateral (C) versus injured (I) hemisphere. Dotted line represents an uninjured (U) animal injected with nanoparticles. Error bars represent SEM, One-way ANOVA, n=3 *p<0.05, **p<0.01. 10 µm sections taken from brain administered nanoparticles 5 minutes after injury and stained for nuclei (blue), FAM-labeled peptide (green), and (D) astrocytes (red; GFAP), (E) microglia (red; Iba1), or (F) neurons (red; NeuN). White dashed line markers the boundary of shear injury, the box indicates magnified inset (bottom), and arrows denote cells which stain positively for both NeuN and peptide. Scale bar represents 100 µm. (G) Quantification of total counts and percentages of NeuN, Iba1, and GFAP positive populations from images.

