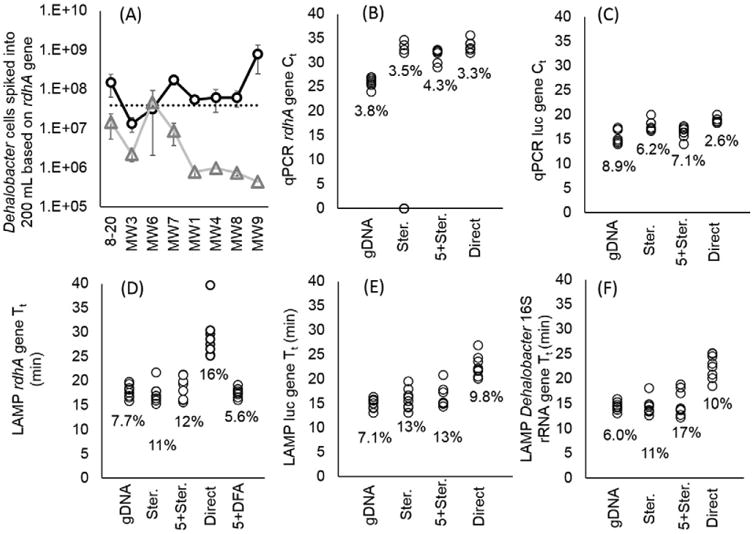
Fig.4.

Comparing methods of biomass concentration followed by LAMP on Gene-Z or qPCR in real-time cycler with TCA-20 spiked into 200 mL of eight separate groundwater samples. A) Estimated quantity of Dehalobacter cells based on calibration curves and Tt and Ct of DFA (circle) and qPCR of gDNA (triangle), respectively. The dotted line represents total number of cells spiked into 200 mL of groundwater samples prior to sample processing. Error bars represent standard error of Tt between three replicates. B–F) Graphs showing Tt and Ct of different assays measured with MIAC and TCA-20 spiked into 200 mL of eight separate groundwater samples prior to sample processing including filtration with Sterivex and direct LAMP (Ster.), a filter train with 5 micron filter prior to Sterivex (5 + Ster.), no filtration prior to amplification (Direct), conventional sample preparation using vacuum filtration followed by DNA extraction (gDNA), and direct filter amplification (DFA). Percentage indicates the Tt or Ct coefficient of variation (CV) among the eight groundwater samples.
