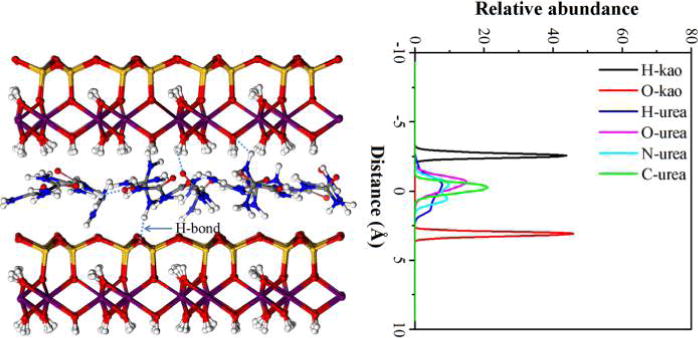
Figure 4.

Snapshot of kaolinite–urea complex model after the system reached equilibrium (left panel) and atom abundance profiles of intercalated urea perpendicular to the basal surface of kaolinite (right panel) (The origin of right panel is placed at the middle plane of kaolinite interlayer space). The ball color scheme for kaolinite layer is O, red; H, white; Si, orange; and Al, purple; for urea it is C, gray; N, blue; O, red; and H, white.
