
Fig. 4.
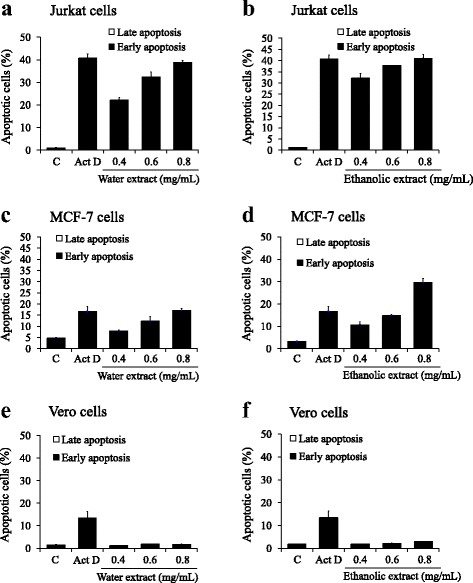
Flow cytometric analysis of apoptosis induction in Jurkat (a, b), MCF7 (c, d) and Vero (e, f) cells. Cells were treated with various concentrations of water and ethanolic extracts prepared from the powdered formula of H. cordata fermented broth and P. emblica fruit for 24 h. The Annexin V-FITC/PI staining apoptotic cells were analyzed using flow cytometry. Actinomycin D (Act D; 10 μg/mL) was used as a positive control. Bar graph shows the summarized data from three independent experiments performed in duplicate compared with untreated control (c)