
Fig. 4.
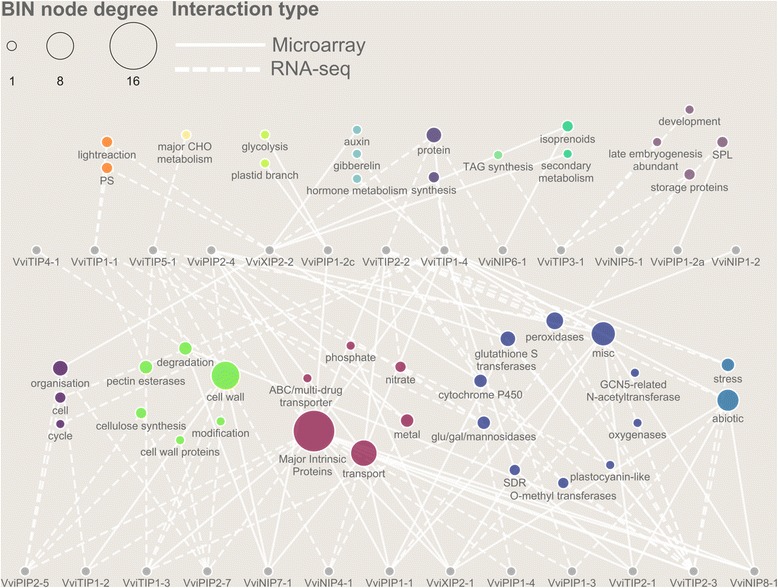
Enriched functional categories identified from composite microarray and RNA-seq MIP gene co-expression networks. Node color represents the parent functional BIN category at BIN depth ≤ 1. Circle size represents the frequency of microarray and/or RNA-seq MIP gene co-expression networks enriched with the corresponding functional BIN category. Solid and dashed edges represent enriched functional BIN category in relevant microarray and RNA-seq MIP gene co-expression networks, respectively