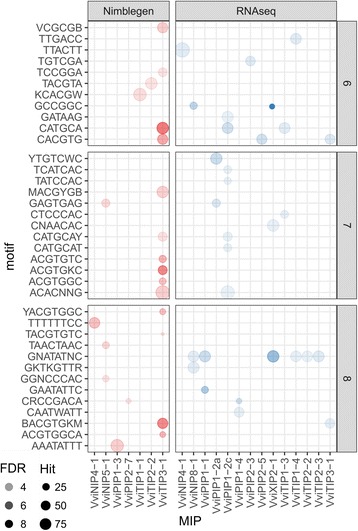
Fig. 6.

Enriched cis-regulatory elements within shared MIP co-expression networks. Enriched CREs between 6- and 8-mer are depicted as separate panels. Circle opacity represents the enrichment score (−log10 FDR values) of the corresponding enriched CRE and circle size of represents the total number of genes containing the enriched CRE
