
Fig. 4.
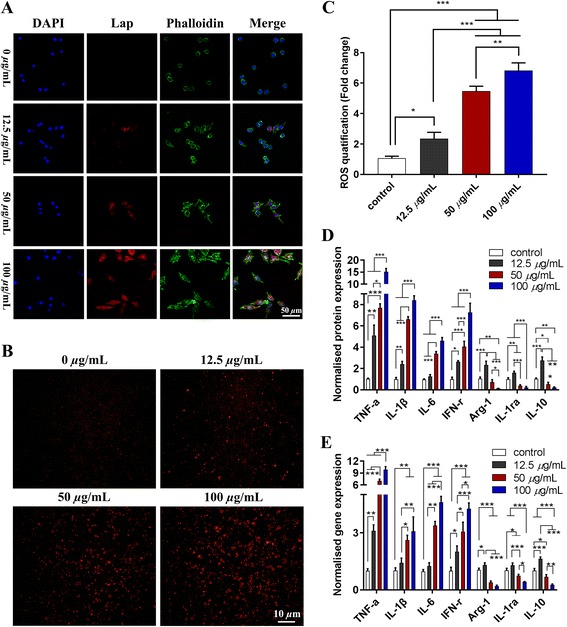
The morphological change (a), reactive oxygen species (ROS) staining (b), and quantification (c) of RAW264.7 cells in the control group (Lap 0 μg/mL) and Lap (12.5, 50, 100 μg/mL) groups. ELISA assay (d), and mRNA expression (e) of the proinflammatory (tumor necrosis factor alpha (TNF-α), interferon-gamma (IFN-γ), interleukin (IL)-6, IL-1β) and anti- inflammatory (IL-1α, IL-10, arginase 1 (Arg-1)) cytokines from RAW264.7 cells in the control and Lap groups. The experiment was repeated three times with similar results. *P < 0.05, **P < 0.01, ***P < 0.001