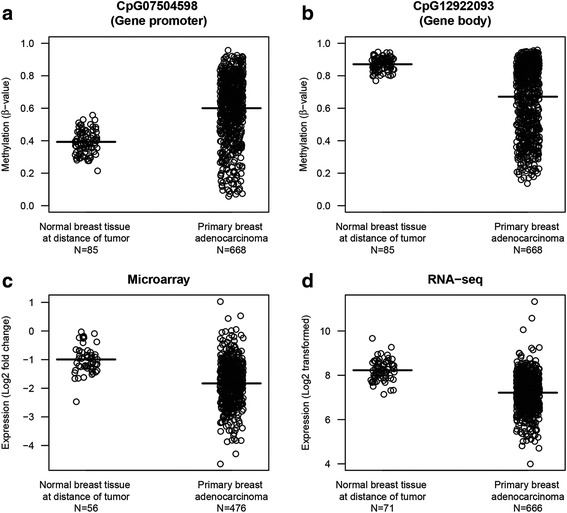
Fig. 3.

DFNA5 methylation and expression in breast adenocarcinomas and normal breast tissues. Panels a and b DFNA5 methylation values are reported for the primary breast adenocarcinomas and normal breast tissues at a distance of the tumor in two CpGs, as a typical example of DFNA5 methylation. Panels c and d DFNA5 expression values are reported for microarray (panel c) and RNA-seq (panel d) experiments for both the primary breast adenocarcinomas and normal breast tissues at a distance of the tumor. Negative expression values for the microarray data indicate a downregulation relative to the Universal Human Reference RNA (Stratagene). The means are indicated with a bold line
