
Fig. 5.
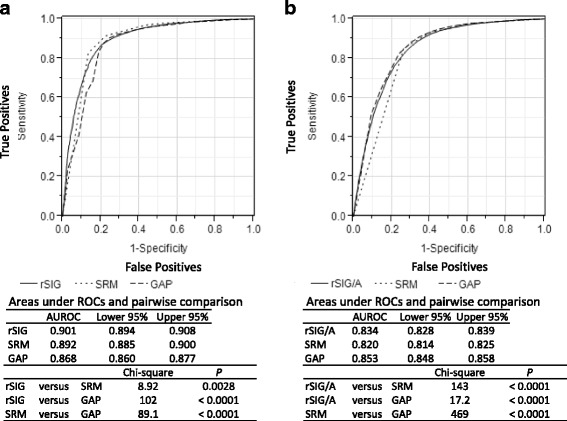
Comparisons of receiver operating characteristic (ROC) curves for in-hospital mortality. The vertical axis shows sensitivity, and the horizontal axis shows 1-specificity. a ROCcurves in younger patients (aged < 55 years). Solid line, reverse shock index × Glasgow Coma Scale score (rSIG); dotted line, simplified regression model (SRM); dashed line, Glasgow Coma Scale, Age, and systolic blood pressure (GAP) score. b ROC curves in older patients (aged ≥ 55 years). Solid line, rSIG ÷ age (rSIG/A); dotted line, SRM; dashed line, GAP score