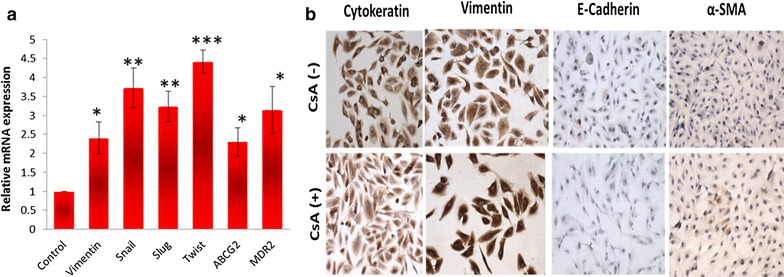
Fig. 2.

Expression of mesenchymal phenotype and chemoresistance genes in A498 cell line. a Cells were treated with CsA and analysed for the expression of various genes (vimentin, snail, slug, twist, ABCG2 and MDR2) evaluated with real time quantitative PCR. b Light microscopic images show decreased expression of both pan-cytokeratin and E-cadherin and increased expression of vimentin in cells treated with CsA (10 µM). The cells without treatment were taken as control cells. Magnification—×20
