
Fig. 7.
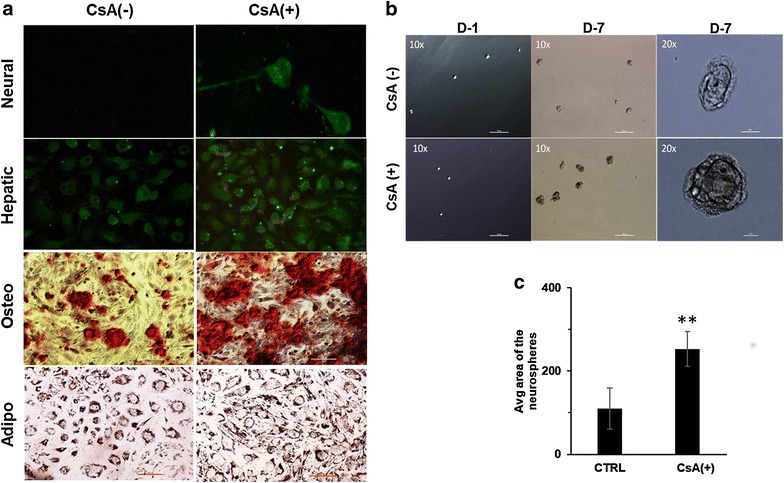
EMT induced cells differentiate into different lineages a Neural differentiation on day 21 of CsA-treated (CsA+) and control cells (CsA−). Immunostaining was done with neurofilament as primary antibody (1:50). Magnification 20X. Second panel shows hepatic differentiation on day 28 which was confirmed by LDL uptake. Green color (LDL-Dylight 488) is showing the distribution pattern for LDL receptor on cells while LDL uptake by these cells is shown by red color (LDL-Dylight 549). Magnification 20X. Third panel shows osteogenic differentiation with alizarin red staining of mineralized granules on day 21 of differentiation. Fourth panel shows adipogenic differentiation with oil red O stained lipid droplets in cells, 21 days post-differentiation. Magnification ×10. Scale bar—100 µm). b Neurosphere assay in both control (CsA−) and CsA-treated (CsA+) cells at day 1 and day 7. Larger neurospheres can be observed in CsA-treated cells as compared to control cells on day 7. Scale bar—100 µm. Magnified image of day 7 neurospheres are shown on extreme right. Magnification ×20. Scale bar—10 µm. c Bar diagram showing comparative analysis of neurosphere area between control (CsA−) and CsA treated (CsA+) cells. **P < 0.001