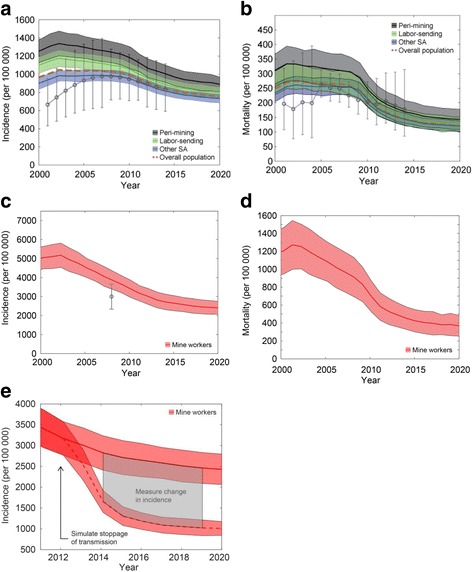
Fig. 2.

Simulated time series of the TB epidemic in different communities in South Africa. Means and 95% CIs were derived from 200 stochastic realizations of the model where input parameters were set at the mode of the posterior distribution of two calibration parameters. a TB incidence in peri-mining, labor-sending, and other South Africa residents. b TB mortality in peri-mining, labor-sending, and other South Africa residents. In a and b, the population-weighted mean of the four populations in the model is also shown. c TB incidence in mine workers. d TB mortality in mine workers. e Methodology for computing the fraction of incidence attributable to recent Mtb transmission in the mines. The upper curve is identical to the curve in c, while the lower curve represents the mean and 95% CI of stochastic realizations that were identical to c until simulated year 2012, after which Mtb transmission from mine workers was stopped but all other aspects of the model remained unchanged. Attribution was calculated from the difference in incidence between simulated years 2014 and 2019
