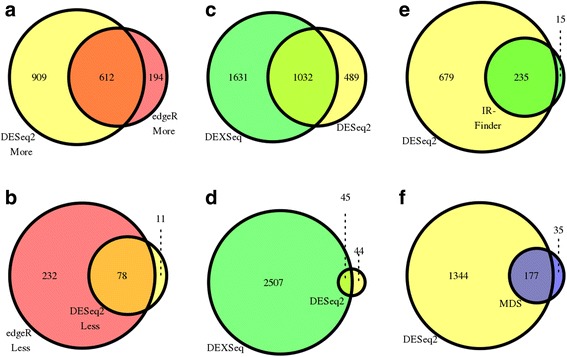
Fig. 3.

Venn diagrams showing the comparisons of: (a) Significantly more retained introns (labeled with “up”) discovered by Interest-DESeq2 and Interest-edgeR (b) As in panel A, but showing data for the significantly less retained introns (labeled with “down”). (c) Significantly more retained introns using the IntEREst-DESeq2 and IntEREst-DEXeq (d) As in panel C, but showing the significantly less retained introns. (e) Significantly retained introns discovered by IntEREst-DESeq2 and the IRFinder [23]. (f) Significantly retained introns discovered by IntEREst-DESeq2 and the significantly retained introns reported by Madan et al. [17], labeled with “MDS”. All the significant more/less retained introns were extracted from the unfiltered MDS data, comparing the ZRSR2mut to the control samples
