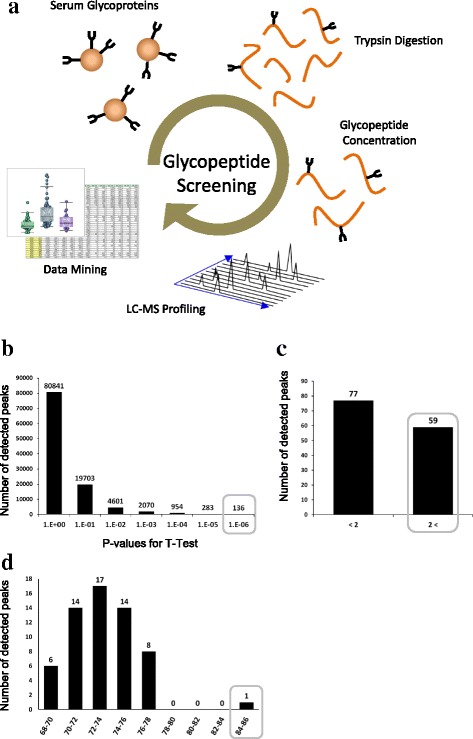
Fig. 1.

Screening of CRC cancer markers. a All isolated serum glycoproteins were digested by trypsin to form peptides, and the glycopeptides were enriched by ultrafiltration and AAL lectin chromatography. Then they were analyzed by LC–TOF–MS. Glycopeptide peak positions (m/z and elution time) and peak intensities (peak areas) were calculated by software developed in our laboratory. The glycopeptide peaks obtained for all serum samples were then aligned and included in a single table, i.e., a peak list. Finally, CRC markers were screened by t-test statistics, mean-fold change analysis, and ROC analysis. CRC markers were extracted with t-test values P < 10− 6, (b), mean-fold change analysis with ratios > 2 (c), and ROC analysis with AUCs > 0.80 (d). The values of the marker were normalized against levels of healthy controls (HEA219)
