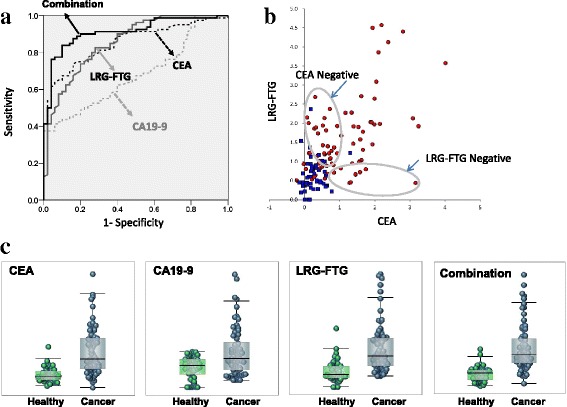
Fig. 3.

Diagnostic performance of LRG–FTG, and currently used CRC markers (CEA and CA19–9). a ROC curves comparing 80 CRC patients with 50 healthy volunteers for CEA, CA19–9, LRG–FTG, and the combination. b Box and whisker plots of CEA, CA19–9, LRG–FTG and the combination. c Scatter plots of CEA (Log10) and LRG–FTG. Red and blue circles represent CRC and healthy volunteers respectively. Combination values are calculated as: Combination factor = Log10 (CEA) × 0.8 + (LRG–FTG) × 0.6
