
Fig. 7.
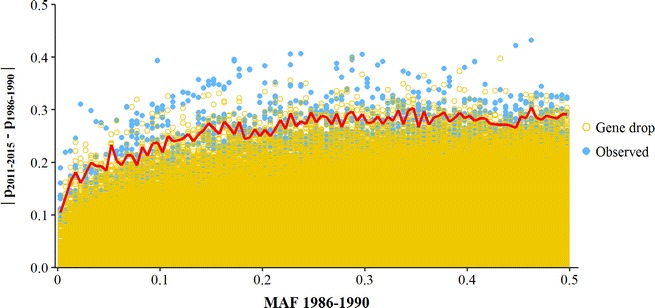
Absolute allele frequency changes from 1986–1990 to 2011–2015 () observed in data and gene drop. Changes are shown for different minor allele frequencies (MAF) in the 1986–1990 period, using MAF-classes of 0.5% (e.g. 0.0–0.5%). The red line represents the 99.9%-threshold of the gene drop distribution per MAF class