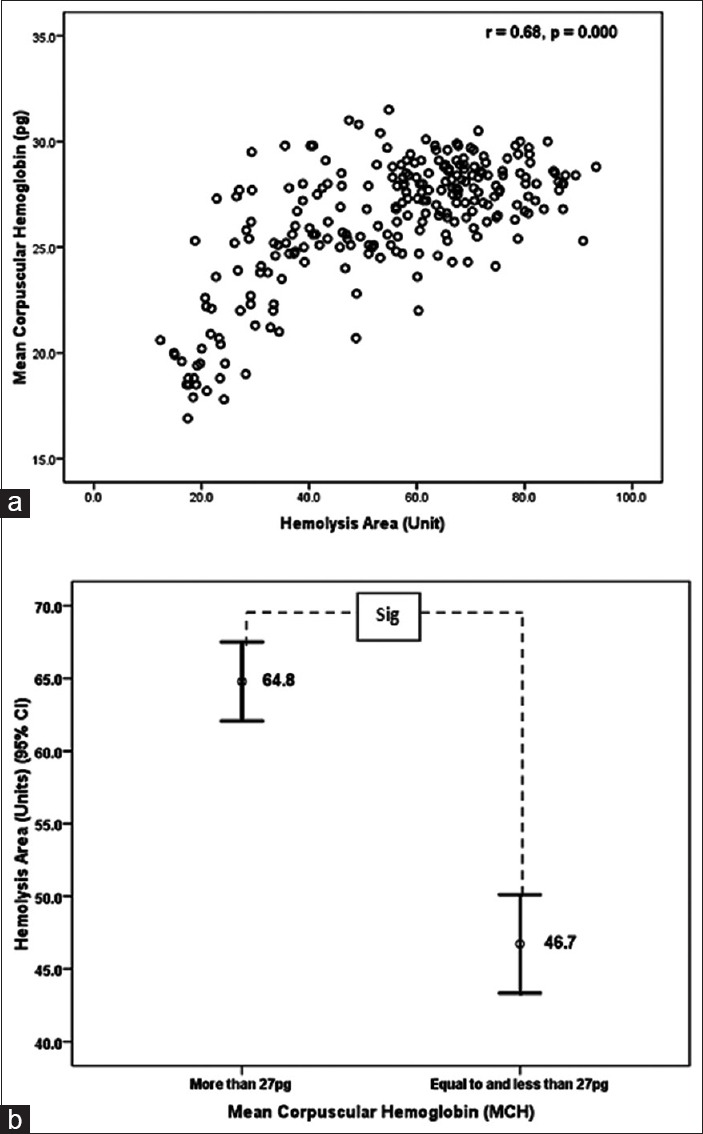
Figure 4.

Relationship of hemolysis area and mean corpuscular hemoglobin values (a) and comparison of hemolysis area values in samples having mean corpuscular hemoglobin >27 pg and ≤27 pg (b). Mean values are placed at the middle of each error bar. “Sig.” indicates statistically significant difference after Student's t-test analysis
