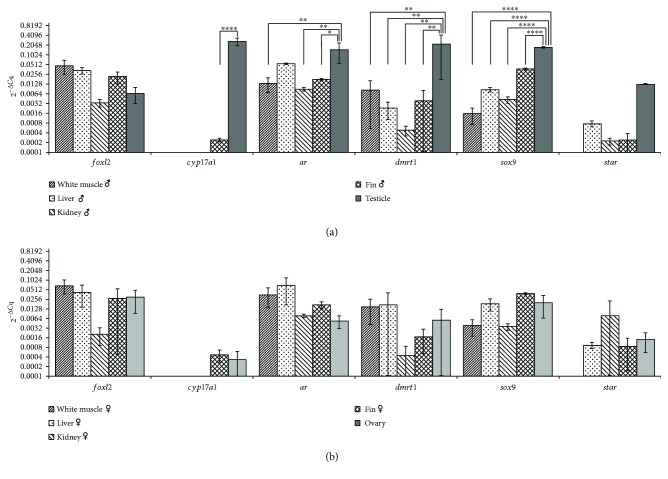
Figure 2.
The 2−ΔCq comparison of foxl2, cyp17a1, ar, dmrt1, sox9, and star genes between organs from males (a) and females (b). The arithmetic mean of gapdh and β-actin reference genes was used for normalization. The data points are represented by arithmetic means ± SD on a logarithmic scale in base two. The statistical significance of the expression comparison was tested with one-way ANOVA using Tukey correction (∗p ≤ 0.05, ∗∗p ≤ 0.01, and ∗∗∗∗p ≤ 0.0001).

