Table 2.
Results of thiazole carboxylic acid (TCA) and imidazole carboxylic acids (ICA) and related analogs.
| Structure | Code | IC50 on MMP-1 (μM) | IC50 on MMP-2 (μM) | IC50 on MMP-9 (μM) | IC50 on MMP-13 (μM) | 3D alignment to 1157 | cLogP |
|---|---|---|---|---|---|---|---|
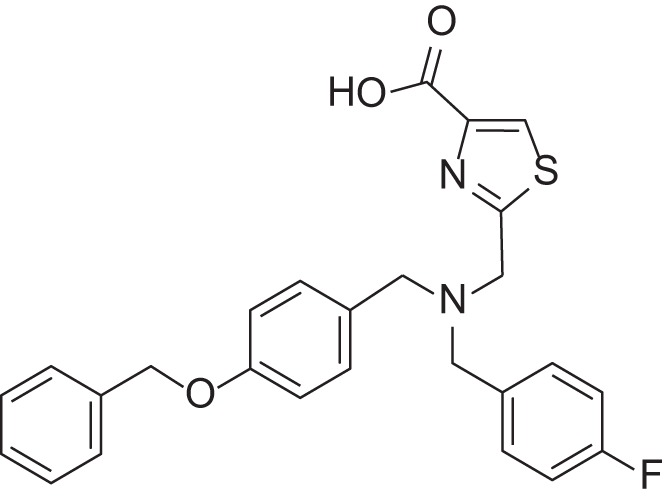 |
MMPI-1157 (TCA) | 3.6 | 3.4 | 15 | 1.6 | 1.00 | 3.33 |
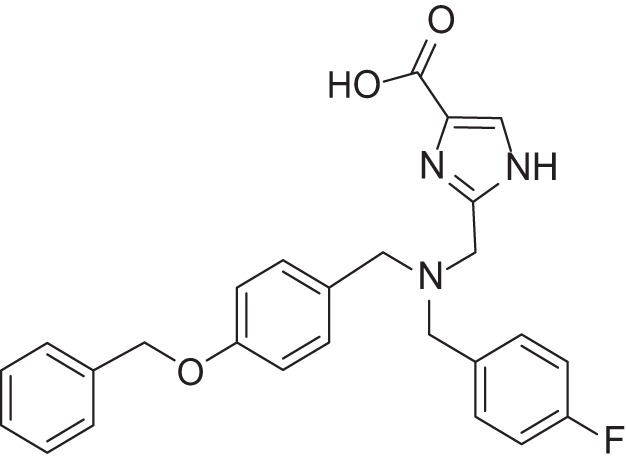 |
MMPI-1154 (ICA) | 10 | 6.6 | 13 | 1.8 | 0.85 | 2.91 |
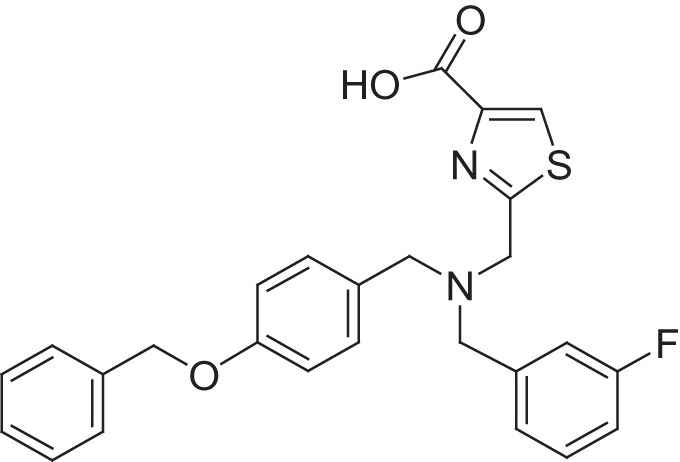 |
MMPI-1133 (TCA) | 6.8 | 25 | 9,8 | 4.7 | 0.932 | 3.37 |
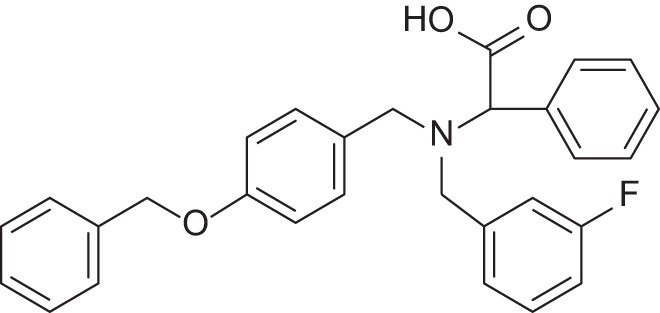 |
MMPI-1140 | 12 | 20 | 39 | 2.6 | 0.56 | 2.91 |
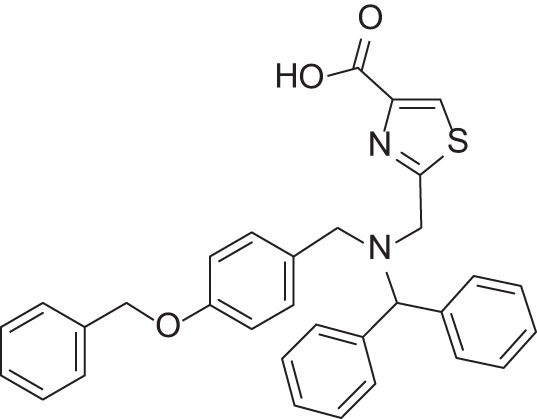 |
MMPI-1155 (TCA) | 26 | 25 | 10 | 1.76 | 0.663 | 4.77 |
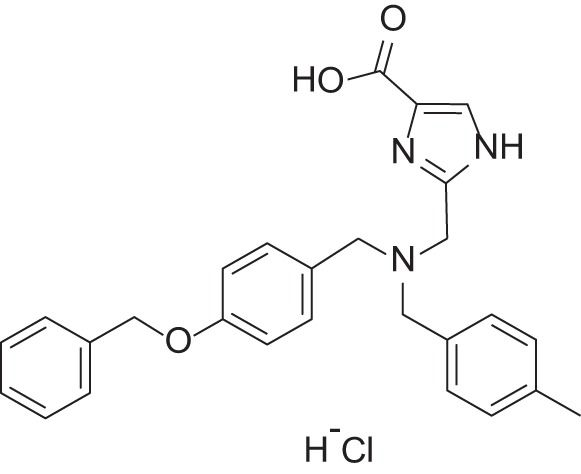 |
MMPI-1247 (ICA) | 33 | 15 | 100 | 3.3 | 0.843 | 3.11 |
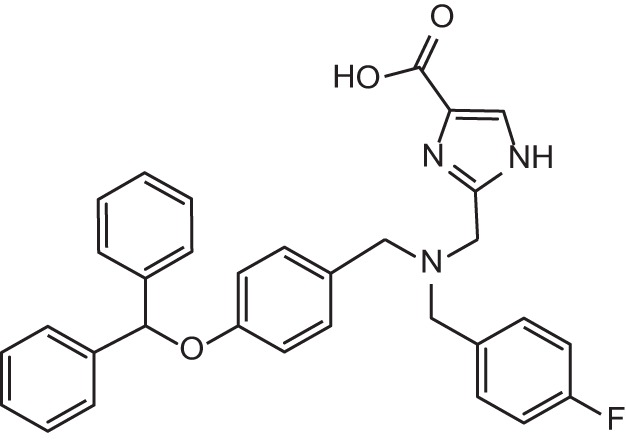 |
MMPI-1245 (ICA) | 16 | 35 | 8 | 0.28 | 0.673 | 4.70 |
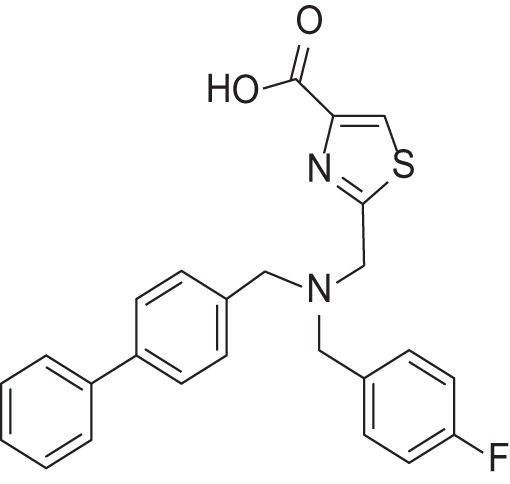 |
MMPI-1254 (TCA) | 17 | 30 | 20 | 3 | 0.739 | 3.39 |
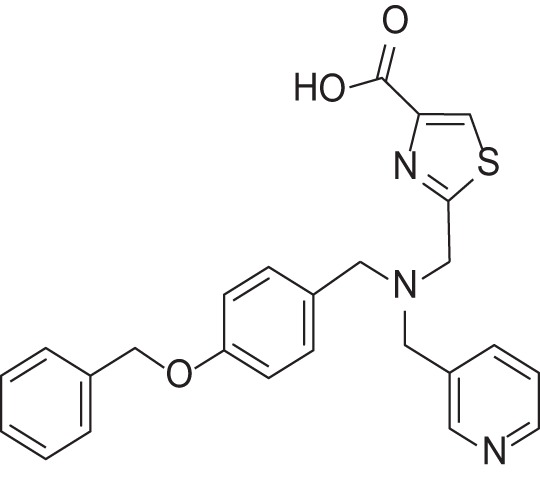 |
MMPI-1253 (TCA) | 240 | 90 | >500 | 8 | 0.927 | 2.22 |
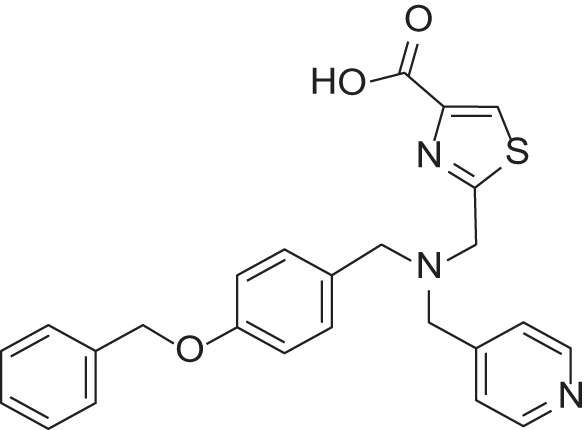 |
MMPI-1252 (TCA) | 115 | 54 | >500 | 1.5 | 0.948 | 2.20 |
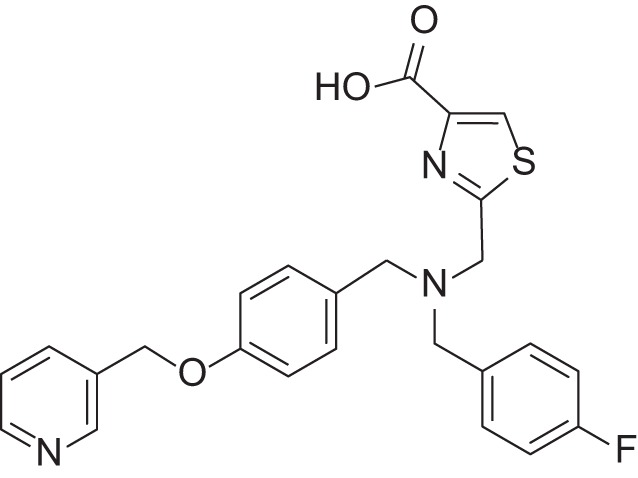 |
MMPI-1260 (TCA) | 51 | 5.7 | 37 | 2.5 | 0.916 | 2.16 |
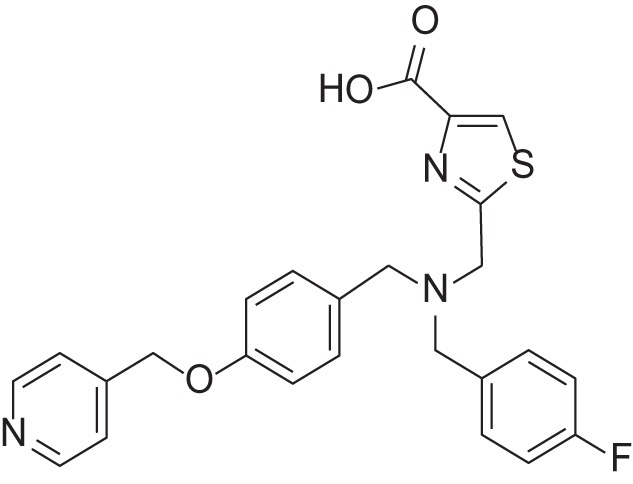 |
MMPI-1248 (TCA) | 47 | 8 | 8.8 | 1.24 | 0.962 | 2.24 |
