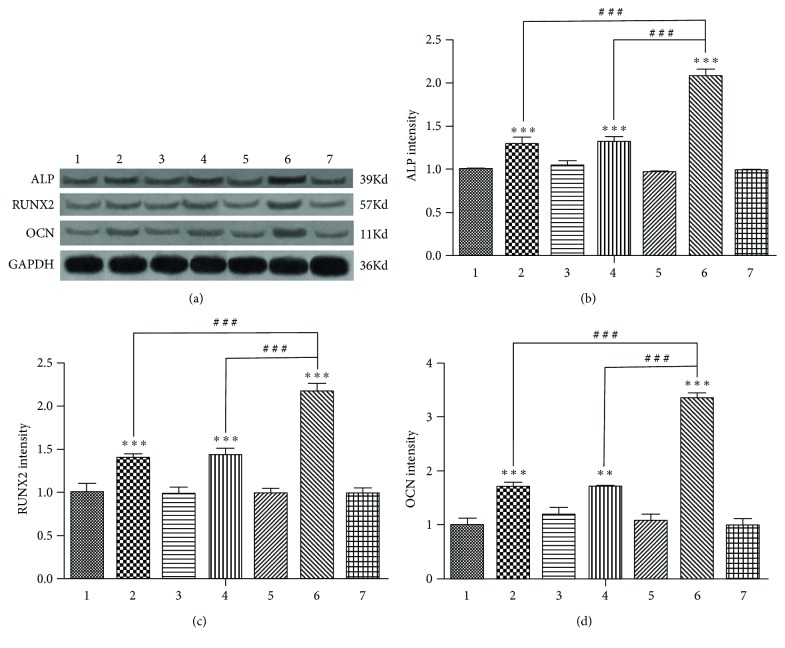
Figure 3.
After 7 days of osteoinduction, Western blotting results showed the same trend of ALP, RUNX2, and OCN protein expression as the Bmal1, Runx2, and Ocn mRNA among the seven groups. GAPDH served as the endogenous reference gene. (a) The result of Western blotting. (b) The ALP protein expression intensity. (c) The RUNX2 protein expression intensity. (d) The OCN protein expression intensity. Densitometry was used to quantify the protein level; the protein level was displayed as the ratio of ALP, RUNX2, and OCN relative to GAPDH. Data represent the mean ± SD (n = 3); the asterisk indicates the group compared to the control groups, that is, group 1, group 3, group 5, or group 7. ∗∗p < 0.01 and ∗∗∗p < 0.001. The pound key indicates a significant difference between the two groups (###p < 0.001).

