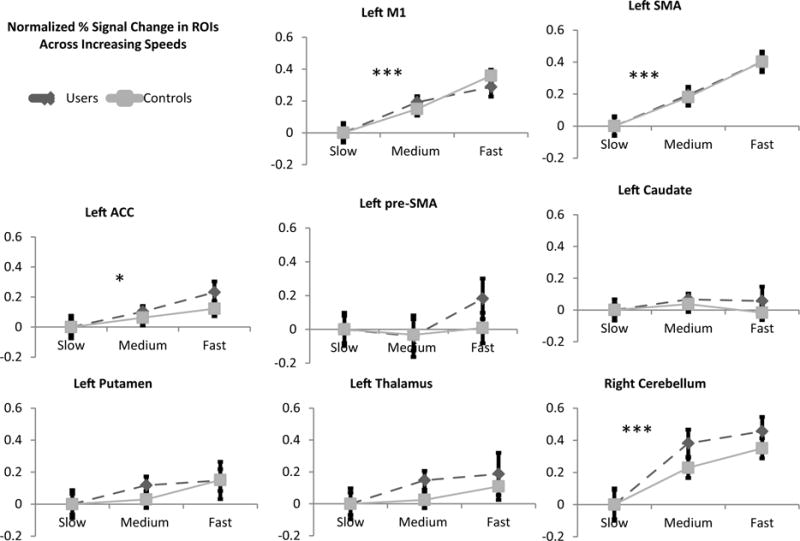
Fig. 2.

Normalized percent signal change in ROIs across finger tapping speeds (Contralateral Network). BOLD percent signal change within the medium and fast task are shown relative to the slow condition. There was no main effect of group when comparing % signal change for various difficulty levels between users (dashed line) and controls (solid gray line). ROIs with a significant main effect of task speed included left M1 (p < 0.001), left SMA (p < 0.001), left ACC (p < 0.05), and right cerebellum (p < 0.001). Left thalamus, left caudate and left putamen showed no main effect of speed. Significant main effects of speed are noted (* = p < 0.05, ** = p < 0.01, ** = p < 0.001).
