Figure 2.

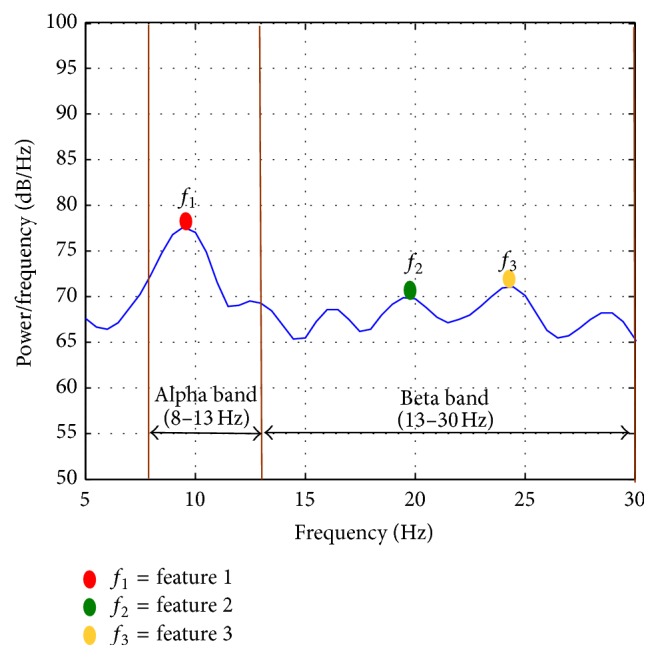
The proposed feature extraction scheme. The curve indicates the PSD of EEG in alpha and beta bands. We selected the highest PSD peak value in the alpha band and the two highest PSD peak values in the beta band as the features.

The proposed feature extraction scheme. The curve indicates the PSD of EEG in alpha and beta bands. We selected the highest PSD peak value in the alpha band and the two highest PSD peak values in the beta band as the features.