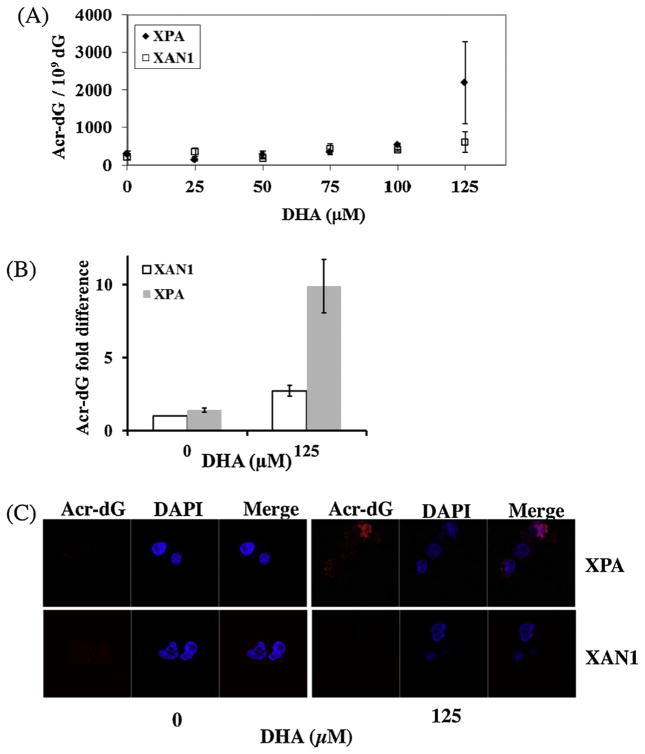
Fig. 2.
Acr-dG levels in XPA vs XAN-1 cells treated with DHA. (A) Acr-dG levels measured by LC–MS/MS in two cells treated with various concentrations of DHA for 16 h. (B) Fold changes of Acr-dG levels in XPA and XAN1 cells treated with 125 μM DHA (p = 0.016). To eliminate the batch variations, we calculate the fold changes of Acr-dG levels by comparing the adduct levels in untreated XPA and treated XAN1and XPA cells to the Acr-dG level in untreated XAN1 cells in each assay batch. (C) Immunohistochemical staining with anti-Acr-dG monoclonal antibodies. Statistical analysis was done as described in Fig. 1.

