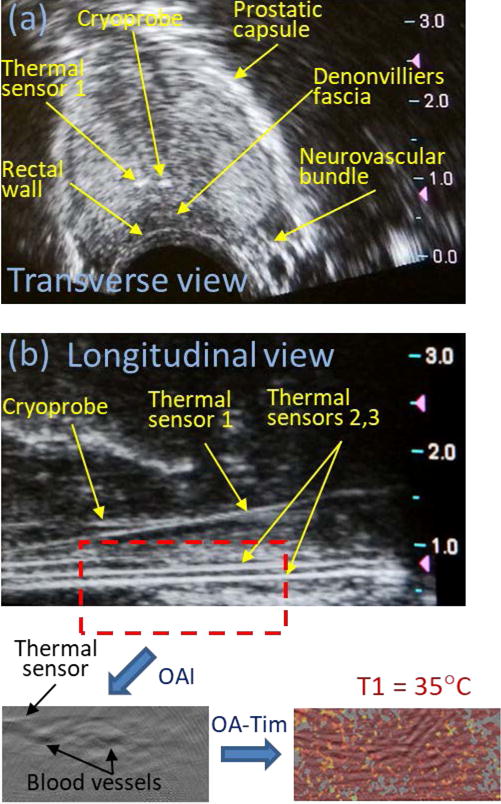
Figure 4.

(a) Transverse and (b) longitudinal ultrasound images of a dog’s prostate prior to initiation of cryotherapy. Red dashed rectangle on the panel (b) indicates the area that included rectal wall and Denonvilliers fascia, which was used for construction of optoacoustic temperature maps. OAI – optoacoustic imaging; OA-Tim – optoacoustic temperature imaging; T1 – initial temperature of the monitored prostate tissue.
