
Fig. 4. TRM cells initiate division in mucosae after reactivation.
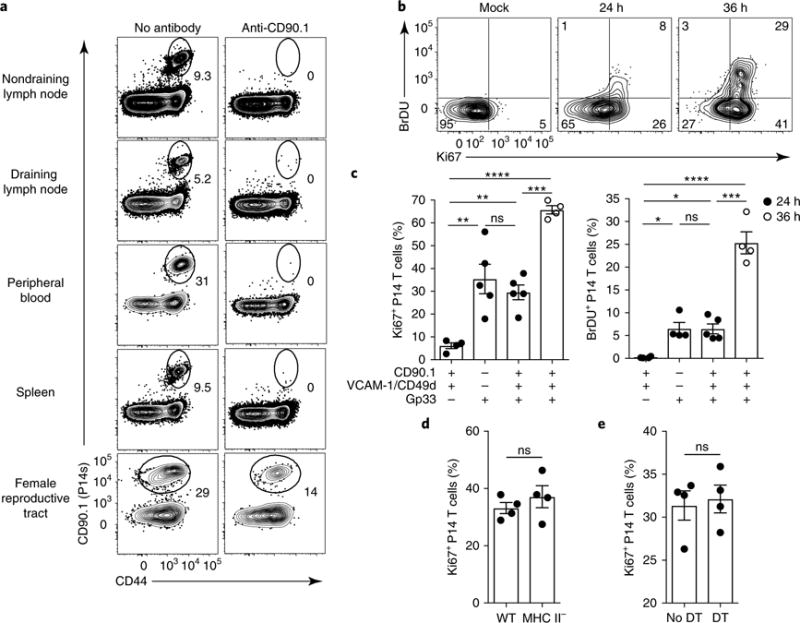
a, The presence of remaining P14 memory CD8+ T cells in the indicated tissues 4 d after i.p. anti-CD90.1 treatment in P14 LCMV immune chimeric mice. Numbers indicate the percentage of cells in the gate. b, P14 immune chimeras were treated as in a. Their blood was assessed for successful depletion of P14 CD8+ T cells 4 d later, and they received anti-VCAM-1 and anti-CD49d i.p. on day 4. On day 5, mice were rechallenged trans-cervically with gp33 peptide or PBS (Mock), and they were assessed 24h or 36 h after rechallenge. Mice received 2 mg of BrdU i.p. 2 h before they were killed, and P14 CD8+ T cells isolated from FRT were stained for Ki67 and BrdU incorporation by flow cyotmetry. Numbers in corners indicate the percentage of cells in the gate. c, The percentage of Ki67+ or BrdU+ cells among P14 CD8+ T cells isolated from the FRT of mice treated with anti-CD90.1, anti-VCAM-1, anti-CD49d and gp33 as indicated. Data points represent individual mice. d, Ki67+CD8+ P14 T cell frequency as enumerated by flow cytometry 24h after challenge in wild-type (WT) and MHC-II-deficient P14 immune chimeric mice treated as in b. e, P14 immune chimeras were generated in CD11c-DTR chimeric mice. Sixty days later, mice were either treated with diphtheria toxin (every 48 h starting 2 d before recall) or left untreated. The mice were also treated with antibodies to CD90.1, VCAM-1, CD49d and gp33 peptide as in b and c. The plot shows the percentage of Ki67+CD8+ P14 T cells isolated from FRT as determined by flow cytometry 24 h after challenge. ns, not significant; *P<0.05, **P<0.01, ***P<0.001, ****P<0.0001; Kruskal-Wallis ANOVA (c) or Mann-Whitney U-test (d,e). Data in c–e are shown as the mean ± s.e.m. Data are representative of two separate experiments with 3 (a) or 4 (d,e) mice per group per experiment, or three separate experiments with 4 mice per group per experiment (b,c).