
Fig. 6. TRM cell proliferation dominates expansion of local secondary memory T cell populations.
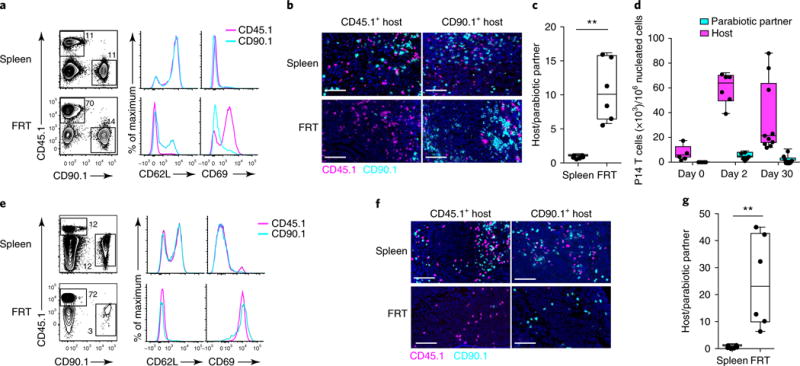
a, Equilibration of recirculating memory CD8+ T cells in parabiotically conjoined CD45.1+ and CD90.1+ P14 immune chimeras challenged trans-cervically with gp33 peptide 14–30 d after surgery. Scale bars, 50 μm. a–g, We analyzed spleen and FRT by flow cytometry 2 d (a) or 30 d (e) after gp33 challenge to evaluate the relative contributions of host and donor P14 CD8+ T cells to the secondary response. Tissues from a CD45.1+ immune chimera are shown, and histograms indicate phenotypes of gated CD45.1+ and CD90.1+ P14 CD8+ T cells at day 2 (a) or day 30 (e) post-recall. CD45.1+ and CD90.1+ P14 CD8+ T cells were also analyzed in each parabiont by immunofluorescence staining 2 d (b) and 30 d (f) after t.c. gp33 challenge. d, Host and parabiotic partner P14 CD8+ T cells enumerated by QIM on the indicated days after trans-cervical gp33 challenge. c,g, The ratio of host and parabiotic partner P14 CD8+ T cells in each parabiont 2 d (c) and 30 d (g) after trans-cervical peptide recall. All data are representative of two separate experiments with at least four parabiont pairs/time points, with a total of > 16 individual mice in individual groups. **P<0.01, Mann-Whitney U-test. In a and e, numbers adjacent to outlines indicate the percentage of cells in the gate. Box plots indicate medians (center lines), 25th and 75th percentiles (bottom and top box edges, respectively), minima and maxima (whiskers), and individual data points (circles).