
Fig. 7. TRM cell proliferation dominates expansion of local secondary memory T cell populations after FRT or skin rechallenge.
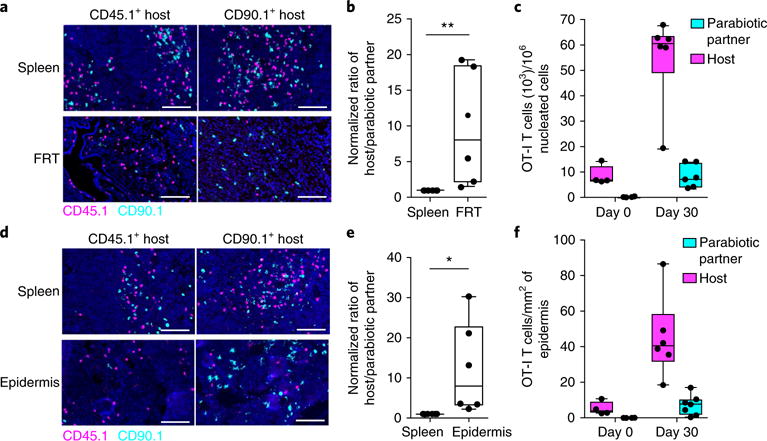
a, Tissues from VSV-OVA-immunized CD45.1+ and CD90.1+ OT-I immune chimeras that were surgically conjoined by parabiosis to achieve equilibration of recirculating memory CD8+ T cells. a–f, Both parabionts were challenged with MVA-OVA 14–30 d after surgery via either the (a–c) trans-cervical or (d–f) epicutaneous route. OT-I CD8+ T cells were analyzed by immunofluorescence staining and enumerated by QIM in either FRT (b,c) or skin epidermis (e,f) and in the spleen 30 d after rechallenge. Magenta, CD45.1; cyan, CD90.1; blue, DAPI (nuclei). Scale bars, 50 μm. Ratios of host and donor-derived OT-I CD8+ T cells were calculated after normalization to the respective ratios in spleen. Absolute numbers of OT-I CD8+ T cells in FRT (c) and skin epidermis (f) in unchallenged and MVA-OVA-challenged (30 d post-recall) mice are shown. All data are representative of two separate experiments with three parabiont pairs per experiment, with a total of 12 individual mice in individual groups. *P< 0.05, **P<0.01, Mann-Whitney U-test (b) or unpaired t-test (e). Box plots indicate medians (center lines), 25th and 75th percentiles (bottom and top box edges, respectively), minima and maxima (whiskers), and individual data points (circles).