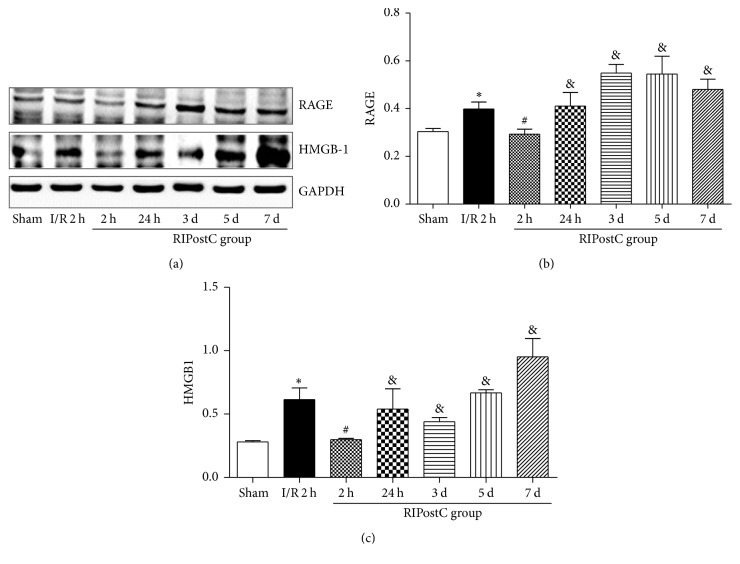
Figure 4.
The expression levels of RAGE and HMGB1 in heart tissue. (a) Western blot analysis of RAGE and HMGB1. GAPDH was used as an internal control. (b) Protein levels of RAGE under different treatments before reperfusion in heart. (c) Protein levels of HMGB1 between I/R and RIPostC group. ∗P < 0.05 versus sham group, #P < 0.05 versus I/R group, and &P < 0.05 versus RIPostC at 2 h.

