
Figure 6.
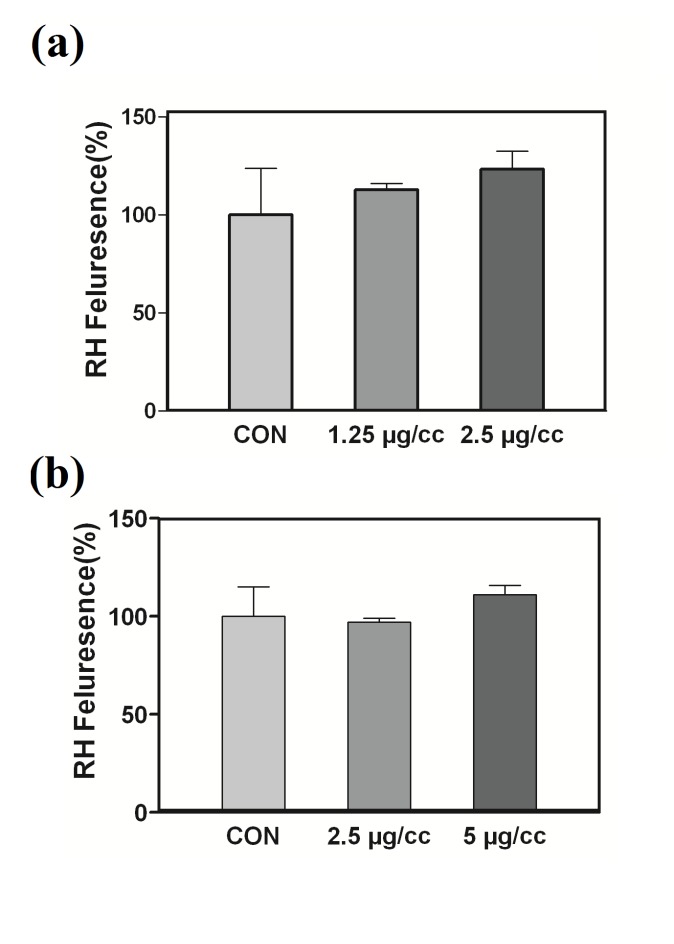
Effect of CQDs on MMP collapse.(a) MCF-7 and (b) PC3 cells were treated with different concentrations of CQDs for 24 h. Graphs show the change in MMP as represented by the mean florescence intensity (MFI) of rhodamine 123.
Official websites use .gov
A
.gov website belongs to an official
government organization in the United States.
Secure .gov websites use HTTPS
A lock (
) or https:// means you've safely
connected to the .gov website. Share sensitive
information only on official, secure websites.
Effect of CQDs on MMP collapse.(a) MCF-7 and (b) PC3 cells were treated with different concentrations of CQDs for 24 h. Graphs show the change in MMP as represented by the mean florescence intensity (MFI) of rhodamine 123.