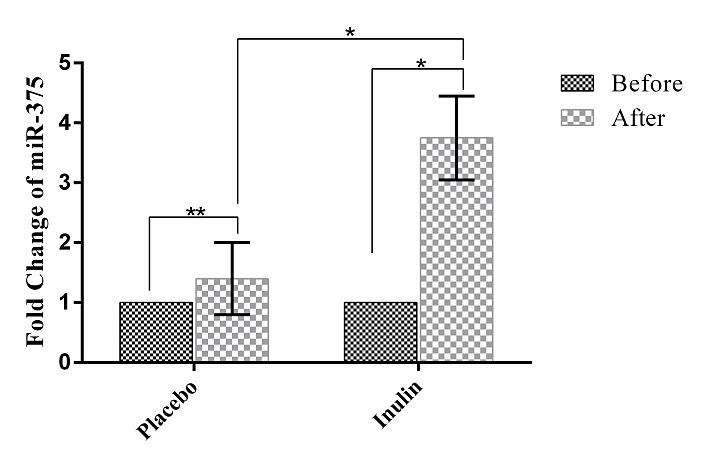
Figure 3.

The plasma levels of miR-375. X-axis represents the study groups and Y-axis shows fold changes of miR-375. Statistical analysis was done by One Sample T test and Independent Sample T test. Each point represents mean±SD. * P-value< 0.05; ** P-value> 0.05.
