
Figure 4.
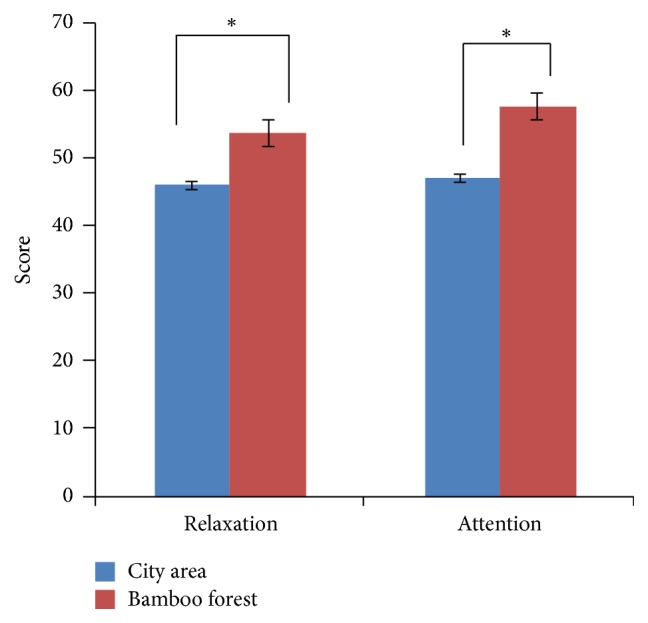
Comparisons of participants' relaxation and attention scores during the bamboo forest and the city area walks. N = 60: mean ± standard error. ∗ p < 0.01: determined using a paired t-test.
Official websites use .gov
A
.gov website belongs to an official
government organization in the United States.
Secure .gov websites use HTTPS
A lock (
) or https:// means you've safely
connected to the .gov website. Share sensitive
information only on official, secure websites.
Comparisons of participants' relaxation and attention scores during the bamboo forest and the city area walks. N = 60: mean ± standard error. ∗ p < 0.01: determined using a paired t-test.