. 2018 Jan 15;9(8):2074–2086. doi: 10.1039/c8sc00010g

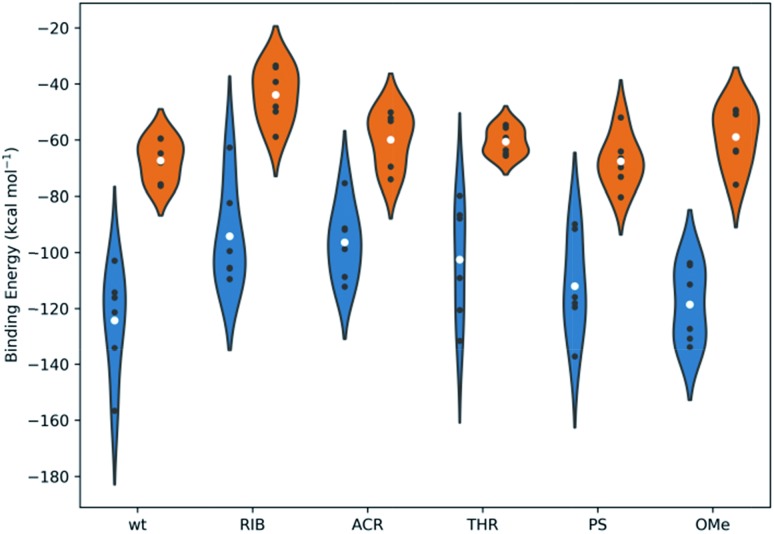
Fig. 7. The binding energies, calculated using the MM-GBSA methodology, for all systems under study. The white dots represent the mean values of the free energy, calculated from 6 independent MD simulations (the values represented as black dots). The kernel distributions, represented by different colors, correspond to the estimated statistical distribution of the binding energies. Blue denotes the simulations started from the crystal coordinates of PDB ID 1SI2 and orange corresponds to those started from the crystal coordinates of PDB ID ; 4F3T. Tables S5 and S6 in the ESI summarize the specific values obtained individually for each simulation and for the averaged data compiled from the 6 replicates.

Fig. 7