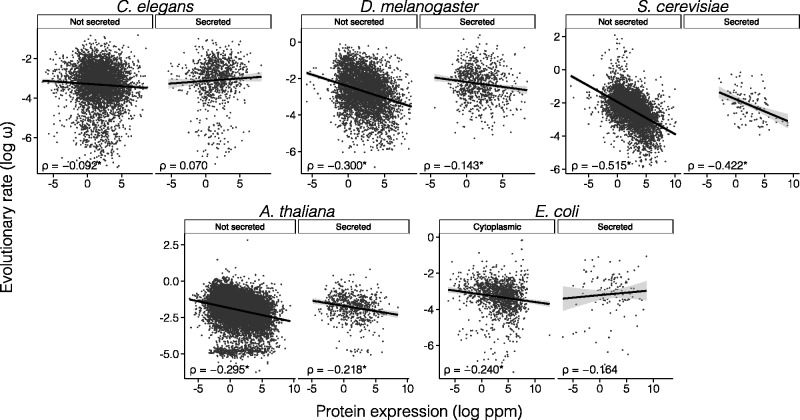
Fig. 4.
Correlation between rates of protein evolution and protein abundance for secreted and nonsecreted proteins in C. elegans, D. melanogaster, S. cerevisiae, A. thaliana, and E. coli. Significant correlation coefficients are marked with an asterisk. ρ, Spearman’s rank correlation coefficient; ppm, parts per million.

