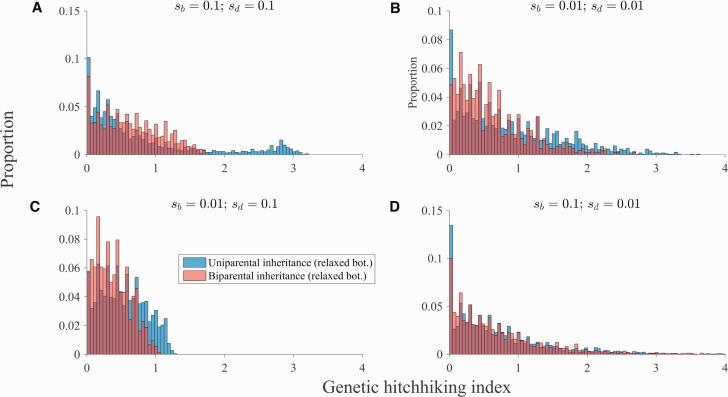
Fig. 7.
Inheritance mode and the distribution of genetic hitchhiking. The distribution of hitchhiking index values for each pair of beneficial and deleterious ratchets. (A beneficial ratchet occurs when the genome with the fewest beneficial substitutions is lost and a deleterious ratchet occurs when the genome with the fewest deleterious substitutions is lost.) Parameters: N = 1000, n = 50, , b = 25, a linear fitness function for the accumulation of beneficial substitutions, and a concave down fitness function for the accumulation of deleterious substitutions. (A–D) correspond to the simulations in panels (C–F) in fig. 6. (A) and . (B) and . (C) and . (D) and . Blue bars pertain to uniparental inheritance, the light pink bars pertain to biparental inheritance, and the dark red bars depict overlapping bars (the dark red bar pertains to whichever color does not show on the top of the bar). We do not plot cases in which the simulation terminates before a beneficial ratchet is followed by a deleterious ratchet. However, we do take these into account when generating the hitchhiking index value: see supplementary fig. S2, Supplementary Material online for details.

