Fig. 8.
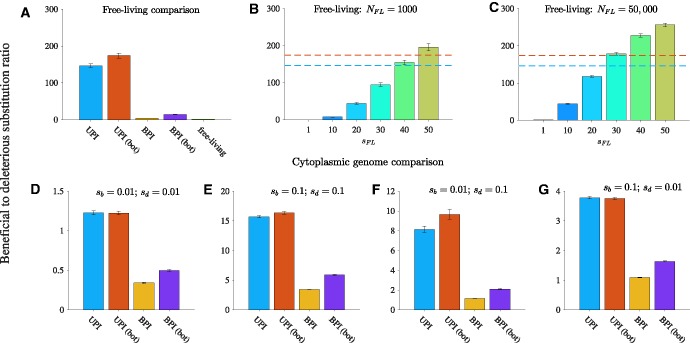
Uniparental inheritance promotes adaptive evolution. Our measure of adaptive evolution is the ratio of beneficial to deleterious substitutions. Parameters (unless otherwise stated): N = 1000, n = 50, , and b = 25 (relaxed transmission bottleneck) or b = 5 (tight transmission bottleneck). UPI: uniparental inheritance with a relaxed bottleneck, UPI (bot): uniparental inheritance with a tight bottleneck, BPI: biparental inheritance with a relaxed bottleneck, and BPI (bot): biparental inheritance with a tight bottleneck. (A) Comparison with free-living genomes. Here, the fitness function for both beneficial and deleterious substitutions in cytoplasmic genomes is linear. Additional parameters (for free-living genomes only): , and sFL = 1. (B–C) Varying the fitness effect of mutations in free-living genomes relative to cytoplasmic genomes (sFL). The horizontal dotted lines show the ratio of beneficial to deleterious substitutions in UPI (relaxed bottleneck) in blue and UPI (tight bottleneck) in orange depicted in A. (B) Population size of free-living genomes is 1000 (equal to the number of hosts in the UPI and BPI models in A). (C) Population size of free-living genomes is 50,000 (equal to the number of cytoplasmic genomes in the UPI and BPI models in A). (D–G) Adaptive evolution in cytoplasmic genomes for a range of selection coefficients. (D) and . (E) and . (F) and . (G) and . To calculate the ratio of beneficial to deleterious substitutions, we first determined the aggregated mean of the number of beneficial and deleterious substitutions for the population at generation 10,000 (average substitutions per cytoplasmic genome). Second, for each of the 500 simulations, we divided the mean number of beneficial substitutions per genome by the corresponding mean number of deleterious substitutions per genome. Finally, we took the mean of the ratios of the 500 simulations. Error bars are ± standard error of this mean.

