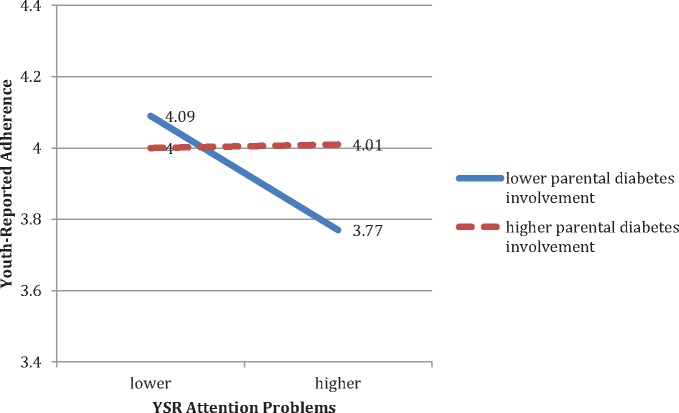
Figure 2.
Simple slopes as a function of youth-reported parents’ diabetes involvement.
Note: Lower and higher values of parents’ diabetes involvement are defined as ± 1 SD about the mean (centered values of −.62 and .62). The simple slope of association between youth-reported attention problems and adherence at Time 1 is not significantly different from zero for those with higher parental diabetes involvement; the simple slope for lower parents’ diabetes involvement is significantly different from zero (see text for simple slope estimates and results of significance tests).

