
Figure 1.
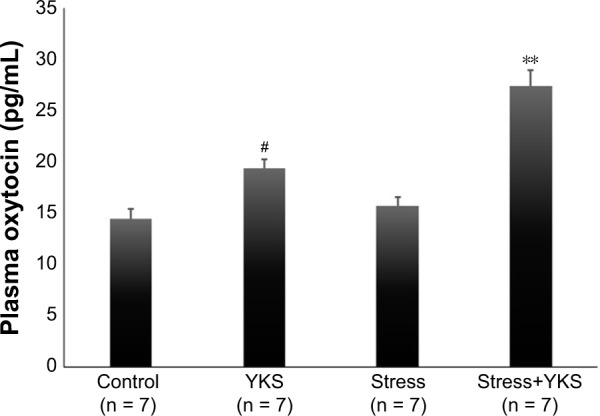
Plasma oxytocin levels (pg/mL) following administration of YKS and acute stress load.
Notes: Data are presented as mean ± SEM. Statistical analysis: one-way ANOVA followed by Tukey’s post hoc test, #P < 0.05 (vs Control group), **P < 0.01 (vs other groups).
Abbreviations: ANOVA, analysis of variance; SEM, standard error of mean; YKS, Yokukansan.