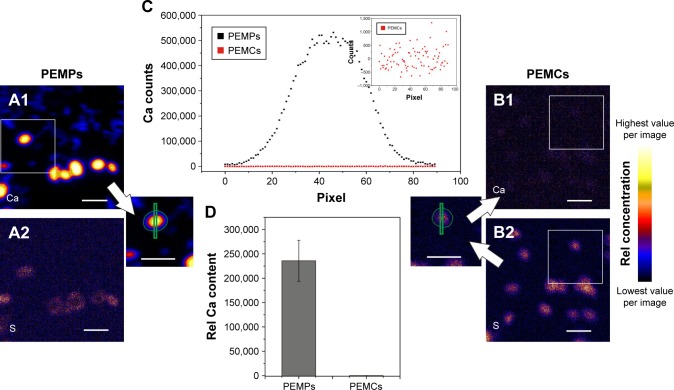
Figure 4.
PIXE analysis of PEMPs and PEMCs to detect free Ca after CaCO3 core dissolution.
Notes: The Ca-maps are shown in A1 (PEMPs) and B1 (PEMCs), whereas the S-maps are shown in A2 (PEMPs) and B2 (PEMCs). PEMP Ca profile lines and Ca outlines (amount) were taken directly from the Ca map, whereas PEMCs were located using S-map, and profile lines and outlines were translated into the Ca map. Representative Ca-profiles (C) of PEMPs (black) and PEMCs (red) indicate the complete CaCO3 removal during core dissolution, which is verified by the relative Ca content (D). Scale bars: 10 µm.
Abbreviations: CaCO3, calcium carbonate; PEMC, polyelectrolyte-coated microcapsule; PEMP, polyelectrolyte-coated microparticle; PIXE, proton-induced X-ray emission; Rel, relative.

