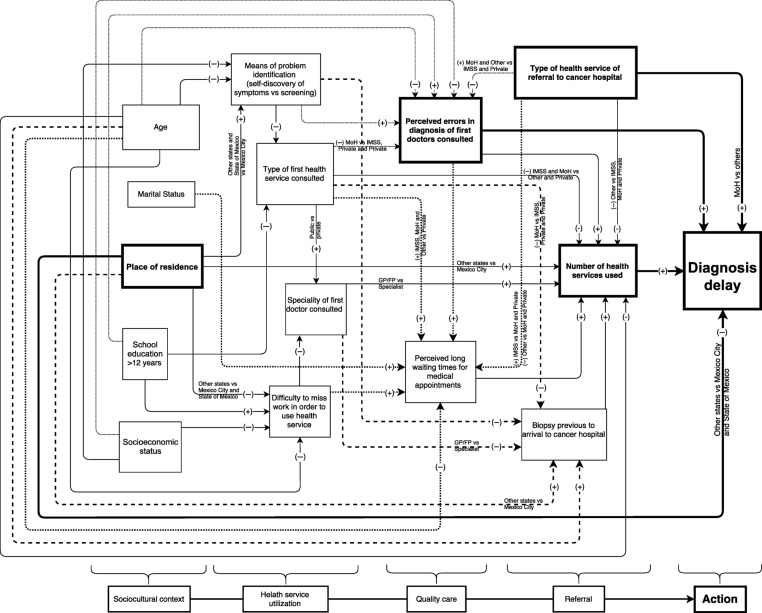
Figure 3.
Path analysis of proposed mechanisms for diagnosis delay. This diagram depicts the proposed causal mechanisms of diagnosis delay. Each arrow reflects the presence of a statistically significant relationship between two variables after controlling for other confounders in multivariate analyses. The multivariate regression models selected for each explanatory variable in the diagram are presented in Table 3. The signs on the arrows reflect whether a positive (+) or negative (−) association was identified between the variables. Variables that were significant in the multivariate analysis of factors impacting diagnosis delay are highlighted in boxes and arrows with thicker lines. At the bottom, a schematic of the conceptual model that guided the inclusion of variables and order of variable inclusion in the path analysis of patient delay is presented.
Abbreviations: GP/FP, General practitioner or Family physician; IMSS, Mexican Social Security Institute; MoH, Ministry of Health.

