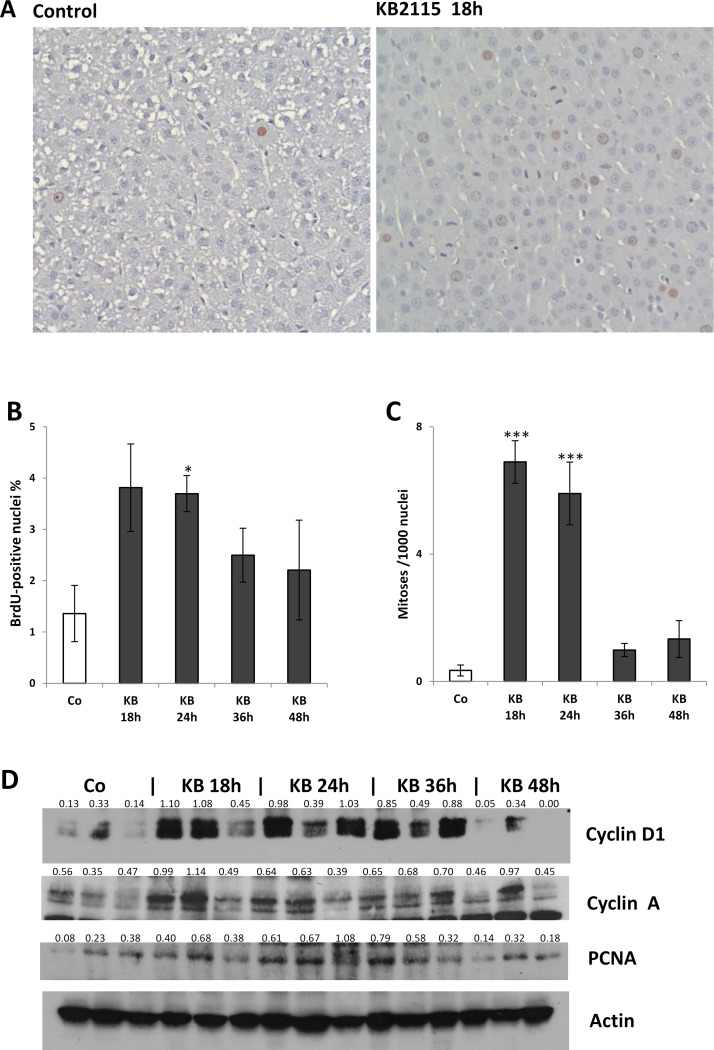
Figure 3.
Time course analysis of KB2115-induced liver cell proliferation. Animals treated with a single IG dose of KB2115 (12.5 μg/100 g b.w.) or DMSO (5% in corn oil, vehicle) were sacrificed at 18, 24, 36, and 48 h after treatment. BrdU was given by IP injection (100 mg/kg) 2 h before sacrifice. (A) Immunohistochemical staining of BrdU in the liver of rats sacrificed 18 h after vehicle or KB2115 showing the presence of several mitoses [counterstained with hematoxylin (20×)]. (B) LI, (C) MI, and (D) Western blot analysis of cell cycle proteins. LI was expressed as number of BrdU+ hepatocyte nuclei/100 nuclei. Mitotic index was calculated as the number of mitotic figures/1,000 nuclei. Results were expressed as means ± SE of three to five rats per group. At least 3,000 hepatocytes per liver were scored. For Western blot, total cell extracts were prepared from frozen livers, and Western analysis was performed as described in Materials and Methods. Actin was used as loading control. Numbers below the blots represent quantification of the bands normalized to actin. Each lane represents an individual sample. Co, controls (DMSO-treated animals). *p < 0.05; ***p < 0.001.

