
Fig. 13.
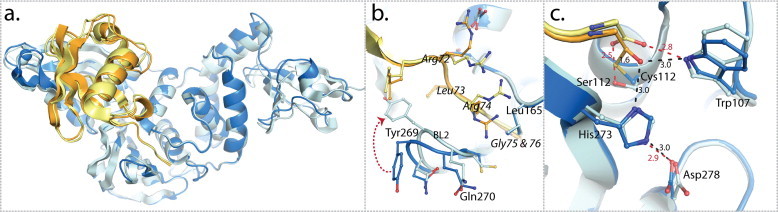
X-ray crystal structures of SARS-CoV PLpro in complex with ubiquitin. (a) An overlay of the crystallographic monomer from the two PLpro–Ub complex (PDB: 4M0W, (Chou et al., 2014) and 4MM3 (Ratia et al., 2014)) crystal structures. The PLpro–Ubal complex is shown in blue with Ubal in orange and the PLproC112S–Ub complex is shown in light blue with Ub in yellow. (b) The conformational difference of the BL2 loop and the different orientations of PLpro BL2 residues and the C-terminal residues (72–76) of Ub (italics labels). (c) The different orientations of the active site residues with the distances between the atoms indicated in angstrom (black for PLpro–Ubal and red for PLproC112S–Ub).