
Figure 4.
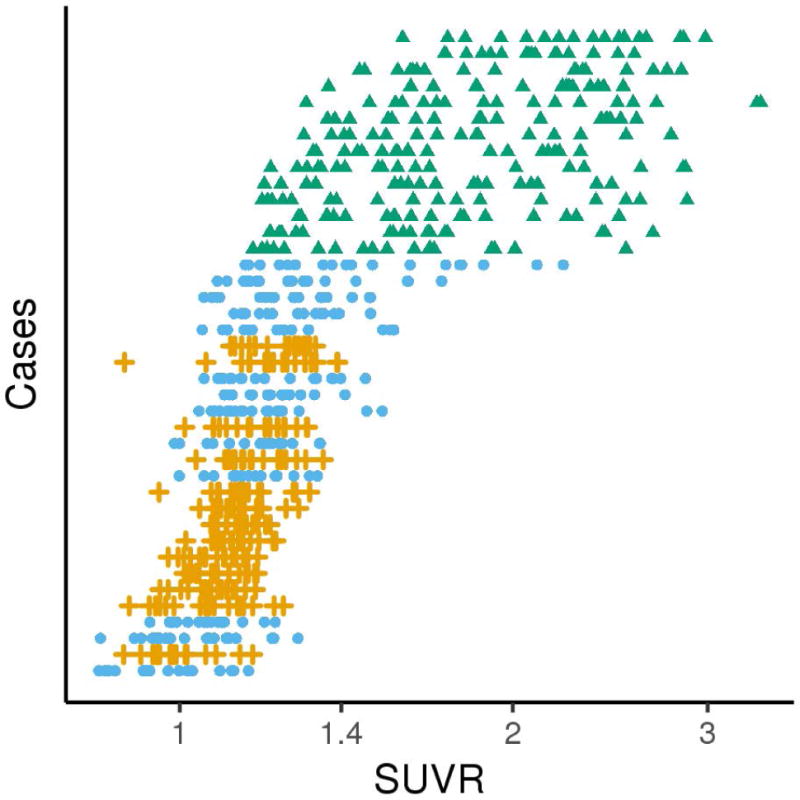
[18F]AV-1451 SUVRs for all nine ROIs (left and right), for each hemisphere, on a log scale. The 40 PPA cases are displayed by descending mean SUVR across all 18 ROIs from top to bottom. As can be seen, the lvPPA patients (green triangles) had the highest [18F]AV-1451 SUVRs while SUVRs across all ROIs overlapped between agPPA (orange crosses) and svPPA (blue circles) patients.