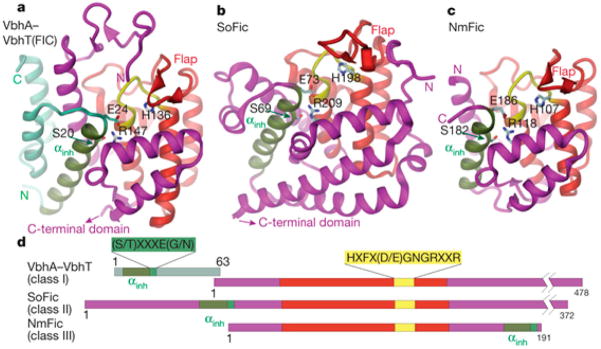
Figure 11.
Classifications of Fic domains. (A–C) Ribbon diagrams of Fic domain structures. Fic domain core shown in red, active site loop shown in yellow, inhibitory α-helix shown in green. (A) Class I Fic domain VbhT shown in complex with antitoxin VbhA. (B) Class II Fic domain SoFic (from S. oneidensis). (C) Class III Fic domain from NmFic. (D) Protein domain maps of VbhT/VbhA, SoFic, and NmFic. Adapted and reproduced from ref 31. Copyright 2012, with permission from Nature Publishing Group.

