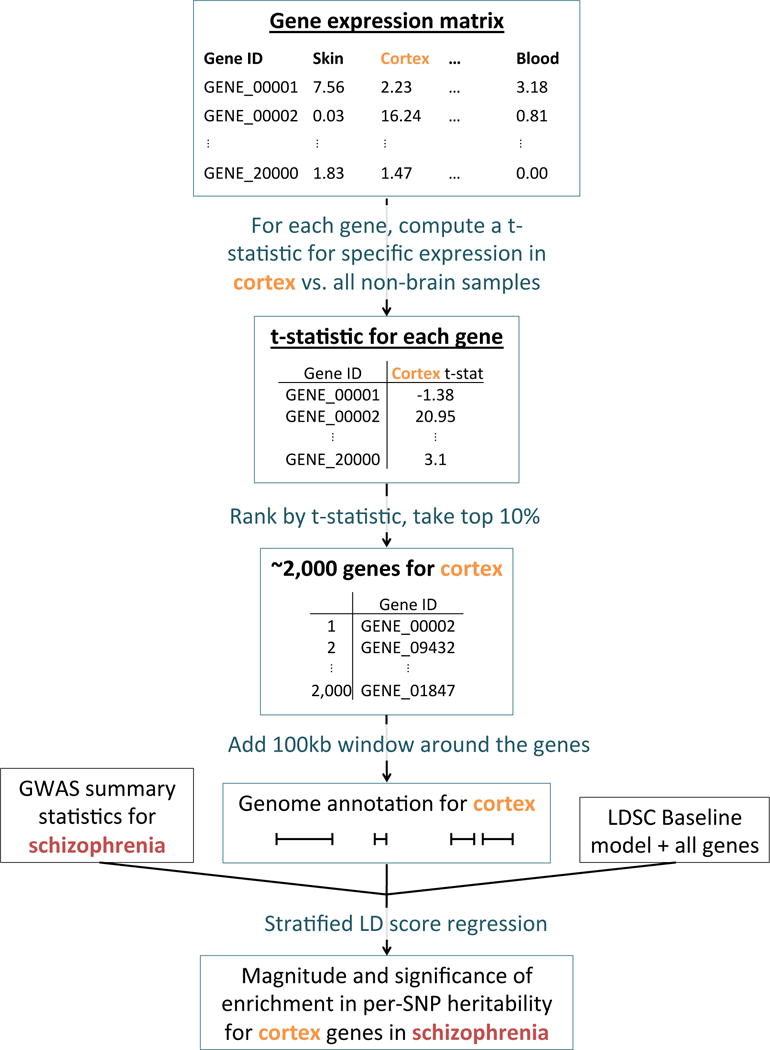
Figure 1.

Overview of the approach. For each tissue in our gene expression data set, we compute t-statistics for differential expression for each gene. We then rank genes by t-statistic, take the top 10% of genes, and add a 100kb window to get a genome annotation. We use stratified LD score regression7 to test whether this annotation is significantly enriched for per-SNP heritability, conditional on the baseline model7 and the set of all genes.
