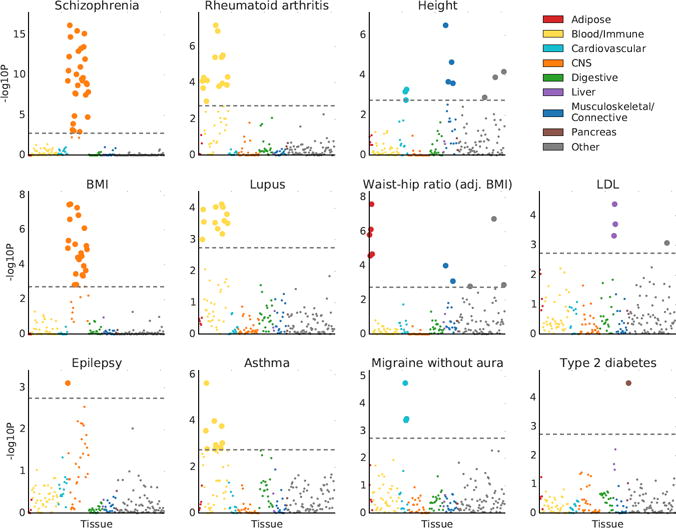
Figure 2.

Results of the multiple-tissue analysis for selected traits. Results for the remaining traits are displayed in Figure S1. Each point represents a tissue/cell type from either the GTEx data set or the Franke lab data set. Large points pass the FDR<5% cutoff, –log10(P)=2.75. GWAS data is described in Table S4, gene expression data is described in the Online Methods and Tables S2-3, and the statistical method is described in the Overview of Methods and the Online Methods. Numerical results are reported in Table S6.
