
Figure 3.
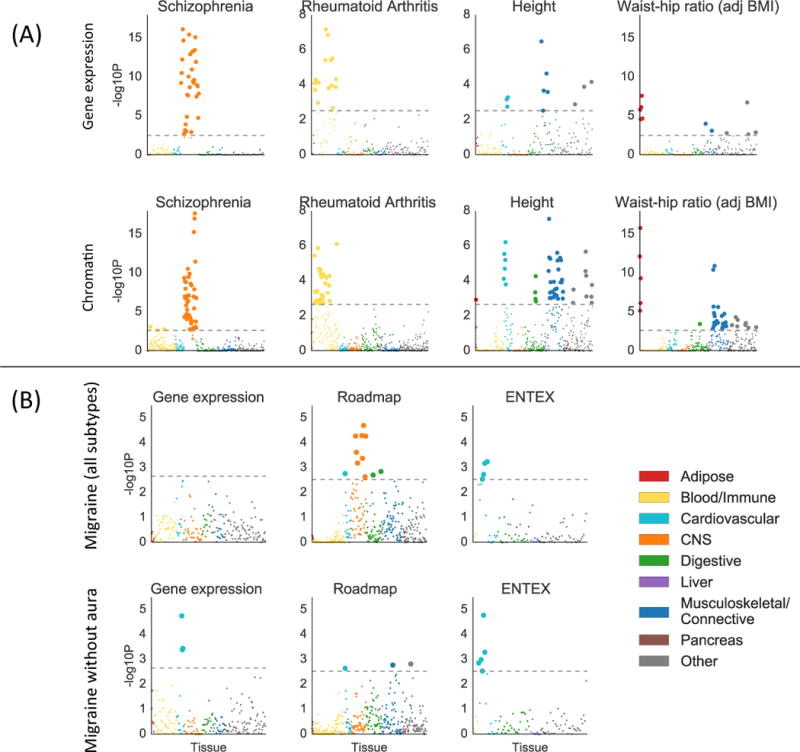
Validation of gene expression results with chromatin data. (A) Examples of validation using chromatin data (bottom) of results from gene expression data (top), for selected traits. Results using chromatin data for all traits are displayed in Figure S5, with numerical results in Table S7. For the chromatin results, each point represents a track of peaks for H3K4me3, H3K4me1, H3K9ac, H3K27ac, H3K36me3, or DHS in a single tissue/cell type. (B) Results using gene expression data (including GTEx), Roadmap, and EN-TEx, for migraine (all subtypes) and migraine without aura. For both subfigures, large points pass the FDR<5% cutoff, –log10(P)=2.85 (chromatin) or –log10(P)=2.75 (gene expression). GWAS data is described in Table S4; gene expression data and chromatin data are described in the Online Methods, Tables S2-3, and Table S7; and the statistical method is described in the Overview of Methods and the Online Methods.